Plot of a diagram representing the network structure of a GRiwrm object
Source:R/plot.GRiwrm.R
plot.GRiwrm.RdPlot of a diagram representing the network structure of a GRiwrm object
# S3 method for class 'GRiwrm'
plot(
  x,
  display = TRUE,
  orientation = "LR",
  with_donors = TRUE,
  box_colors = c(UpstreamUngauged = "#eef", UpstreamGauged = "#aaf", IntermediateUngauged
    = "#efe", IntermediateGauged = "#afa", Reservoir = "#9de", DirectInjection = "#faa"),
  defaultClassDef = "stroke:#333",
  header = "%%{init: {'theme': 'neutral'} }%%",
  footer = NULL,
  ...
)
Arguments
- x
[GRiwrm object] data to display. See CreateGRiwrm for details
- display
logical if
TRUEplots the diagram, returns the mermaid code otherwise- orientation
character orientation of the graph. Possible values are "LR" (left-right), "RL" (right-left), "TB" (top-bottom), or "BT" (bottom-top).
- with_donors
logical for drawing boxes around ungauged nodes and their donors
- box_colors
list containing the color used for the different types of nodes
- defaultClassDef
character default style apply to all boxes
- header
mermaid script to add before the generated script (see Details)
mermaid script to add after the generated script
- ...
further parameters passed to mermaid
Value
Mermaid code of the diagram if display is FALSE, otherwise the function returns the diagram itself.
Details
header parameter allows to add any mermaid code injected before the graph
instruction. It is notably useful for injecting directives that impact the
format of the graph. See mermaid documentation on directives for
more details and also the
complete list of available directives.
See also
Examples
library(airGRiwrm)
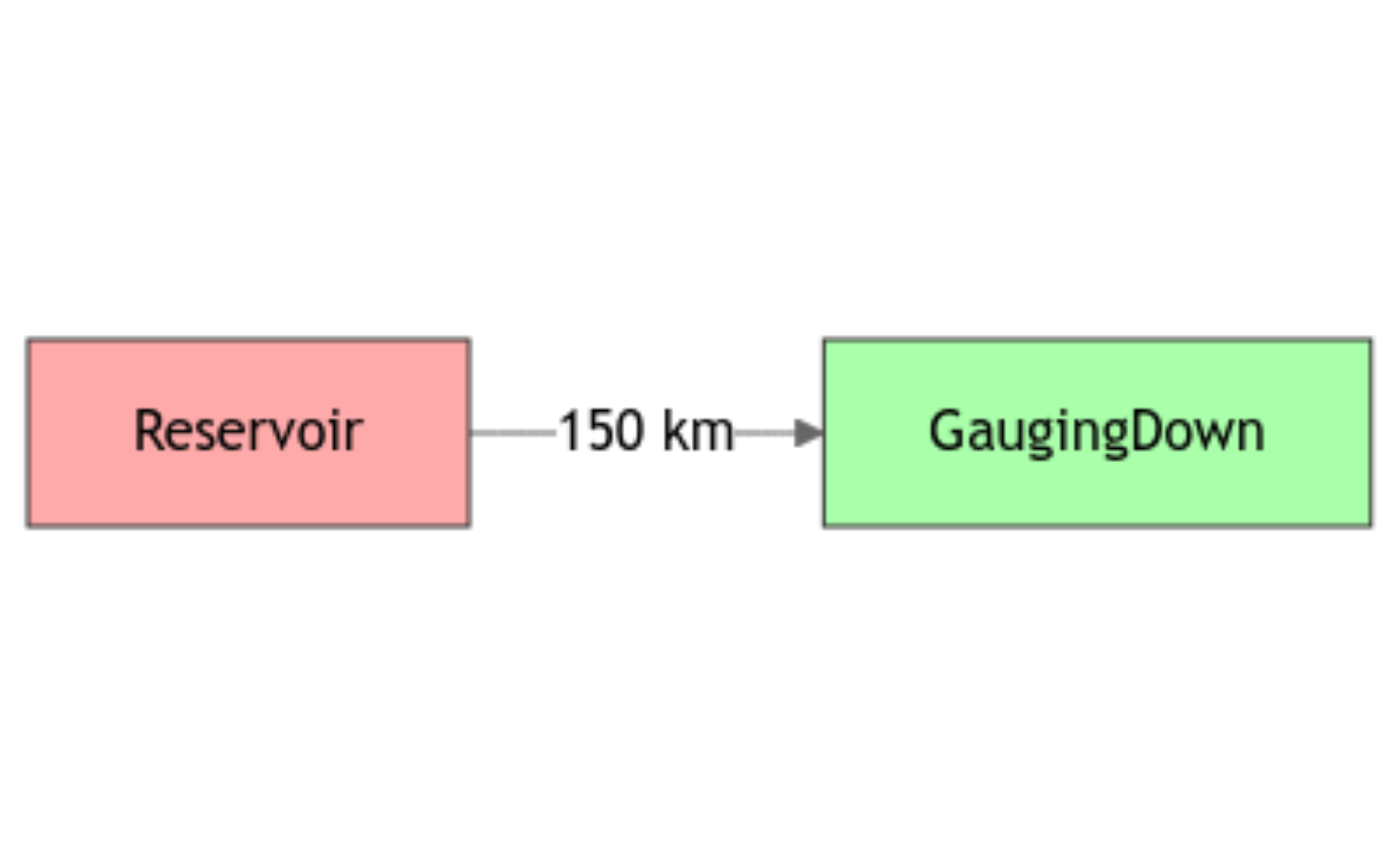
#########################################
# Network of 2 nodes distant of 150 km: #
#########################################
# - an upstream reservoir modeled as a direct flow injection (no model)
# - a gauging station downstream a catchment of 360 km² modeled with GR4J
db <- data.frame(id = c("Reservoir", "GaugingDown"),
length = c(150, NA),
down = c("GaugingDown", NA),
area = c(NA, 360),
model = c(NA, "RunModel_GR4J"),
stringsAsFactors = FALSE)
griwrm_basic <- CreateGRiwrm(db)
griwrm_basic
#> id down length area model donor
#> 2 GaugingDown <NA> NA 360 RunModel_GR4J GaugingDown
#> 1 Reservoir GaugingDown 150 NA <NA> <NA>
# Network diagram with direct flow node in red, intermediate sub-basin in green
# \dontrun{
plot(griwrm_basic)
 # }
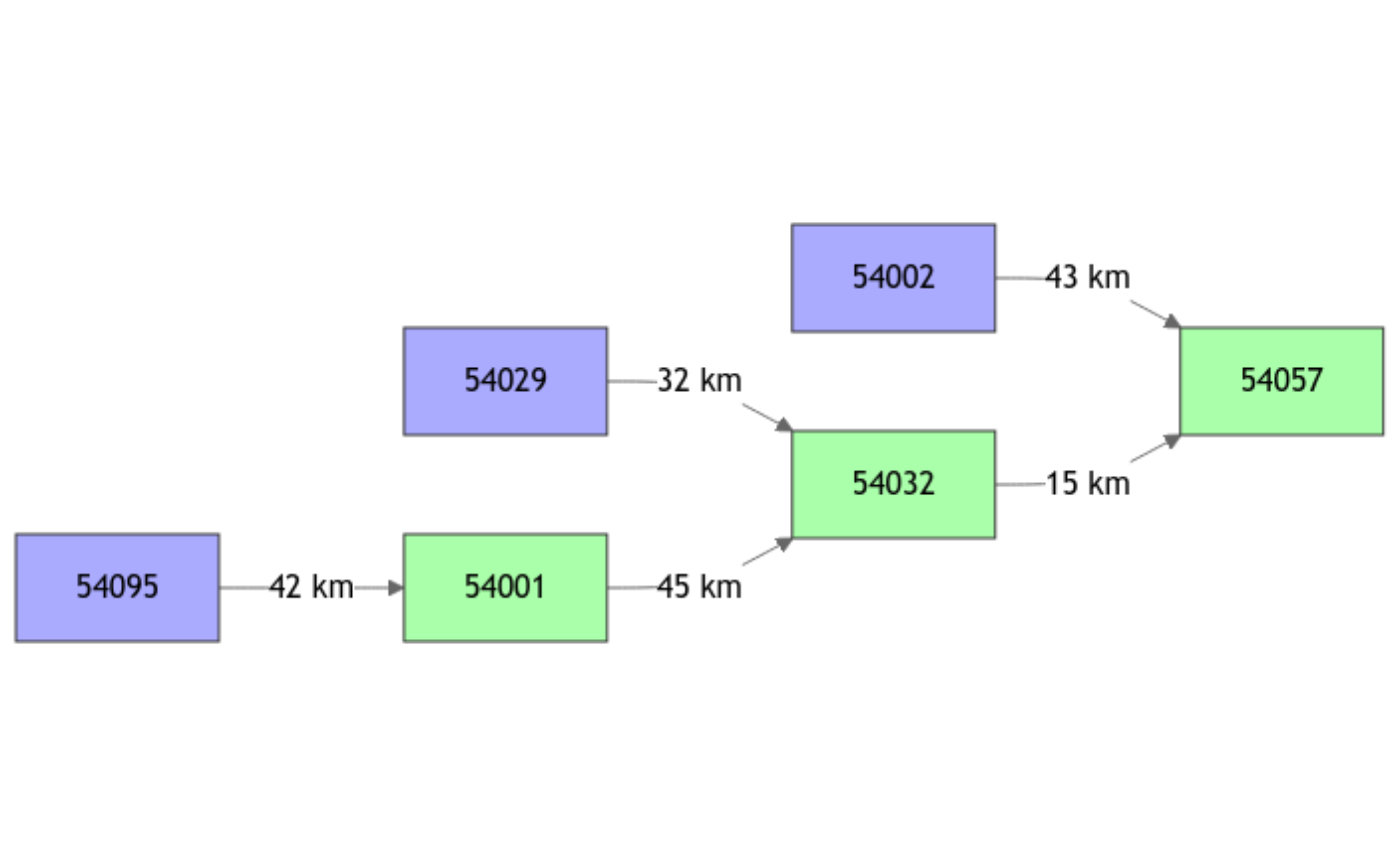
###################################################
# GR4J semi-distributed model of the Severn River #
###################################################
data(Severn)
nodes <- Severn$BasinsInfo
nodes$model <- "RunModel_GR4J"
str(nodes)
#> 'data.frame': 6 obs. of 13 variables:
#> $ gauge_id : chr "54057" "54032" "54001" "54095" ...
#> $ gauge_name : chr "Severn at Haw Bridge" "Severn at Saxons Lode" "Severn at Bewdley" "Severn at Buildwas" ...
#> $ gauge_lat : num 52 52 52.4 52.6 52.1 ...
#> $ gauge_lon : num -2.23 -2.2 -2.32 -2.53 -1.94 -2.39
#> $ area : num 9885 6865 4330 3723 2208 ...
#> $ elev_mean : int 145 170 175 186 99 212
#> $ station_type : chr "VA" "US" "US" "US" ...
#> $ flow_period_start : chr "1971-07-01" "1970-10-01" "1970-10-01" "1984-03-01" ...
#> $ flow_period_end : chr "2015-09-30" "2015-09-30" "2015-09-30" "2015-09-30" ...
#> $ bankfull_flow : num 460 340 420 285 125 190
#> $ downstream_id : chr NA "54057" "54032" "54001" ...
#> $ distance_downstream: num NA 15 45 42 43 32
#> $ model : chr "RunModel_GR4J" "RunModel_GR4J" "RunModel_GR4J" "RunModel_GR4J" ...
# Mismatch column names are renamed to stick with GRiwrm requirements
rename_columns <- list(id = "gauge_id",
down = "downstream_id",
length = "distance_downstream")
griwrm_severn <- CreateGRiwrm(nodes, rename_columns)
griwrm_severn
#> id down length area model donor
#> 4 54095 54001 42 3722.68 RunModel_GR4J 54095
#> 5 54002 54057 43 2207.95 RunModel_GR4J 54002
#> 6 54029 54032 32 1483.65 RunModel_GR4J 54029
#> 3 54001 54032 45 4329.90 RunModel_GR4J 54001
#> 2 54032 54057 15 6864.88 RunModel_GR4J 54032
#> 1 54057 <NA> NA 9885.46 RunModel_GR4J 54057
# Network diagram with upstream basin nodes in blue, intermediate sub-basin in green
# \dontrun{
plot(griwrm_severn)
# }
###################################################
# GR4J semi-distributed model of the Severn River #
###################################################
data(Severn)
nodes <- Severn$BasinsInfo
nodes$model <- "RunModel_GR4J"
str(nodes)
#> 'data.frame': 6 obs. of 13 variables:
#> $ gauge_id : chr "54057" "54032" "54001" "54095" ...
#> $ gauge_name : chr "Severn at Haw Bridge" "Severn at Saxons Lode" "Severn at Bewdley" "Severn at Buildwas" ...
#> $ gauge_lat : num 52 52 52.4 52.6 52.1 ...
#> $ gauge_lon : num -2.23 -2.2 -2.32 -2.53 -1.94 -2.39
#> $ area : num 9885 6865 4330 3723 2208 ...
#> $ elev_mean : int 145 170 175 186 99 212
#> $ station_type : chr "VA" "US" "US" "US" ...
#> $ flow_period_start : chr "1971-07-01" "1970-10-01" "1970-10-01" "1984-03-01" ...
#> $ flow_period_end : chr "2015-09-30" "2015-09-30" "2015-09-30" "2015-09-30" ...
#> $ bankfull_flow : num 460 340 420 285 125 190
#> $ downstream_id : chr NA "54057" "54032" "54001" ...
#> $ distance_downstream: num NA 15 45 42 43 32
#> $ model : chr "RunModel_GR4J" "RunModel_GR4J" "RunModel_GR4J" "RunModel_GR4J" ...
# Mismatch column names are renamed to stick with GRiwrm requirements
rename_columns <- list(id = "gauge_id",
down = "downstream_id",
length = "distance_downstream")
griwrm_severn <- CreateGRiwrm(nodes, rename_columns)
griwrm_severn
#> id down length area model donor
#> 4 54095 54001 42 3722.68 RunModel_GR4J 54095
#> 5 54002 54057 43 2207.95 RunModel_GR4J 54002
#> 6 54029 54032 32 1483.65 RunModel_GR4J 54029
#> 3 54001 54032 45 4329.90 RunModel_GR4J 54001
#> 2 54032 54057 15 6864.88 RunModel_GR4J 54032
#> 1 54057 <NA> NA 9885.46 RunModel_GR4J 54057
# Network diagram with upstream basin nodes in blue, intermediate sub-basin in green
# \dontrun{
plot(griwrm_severn)
 # }
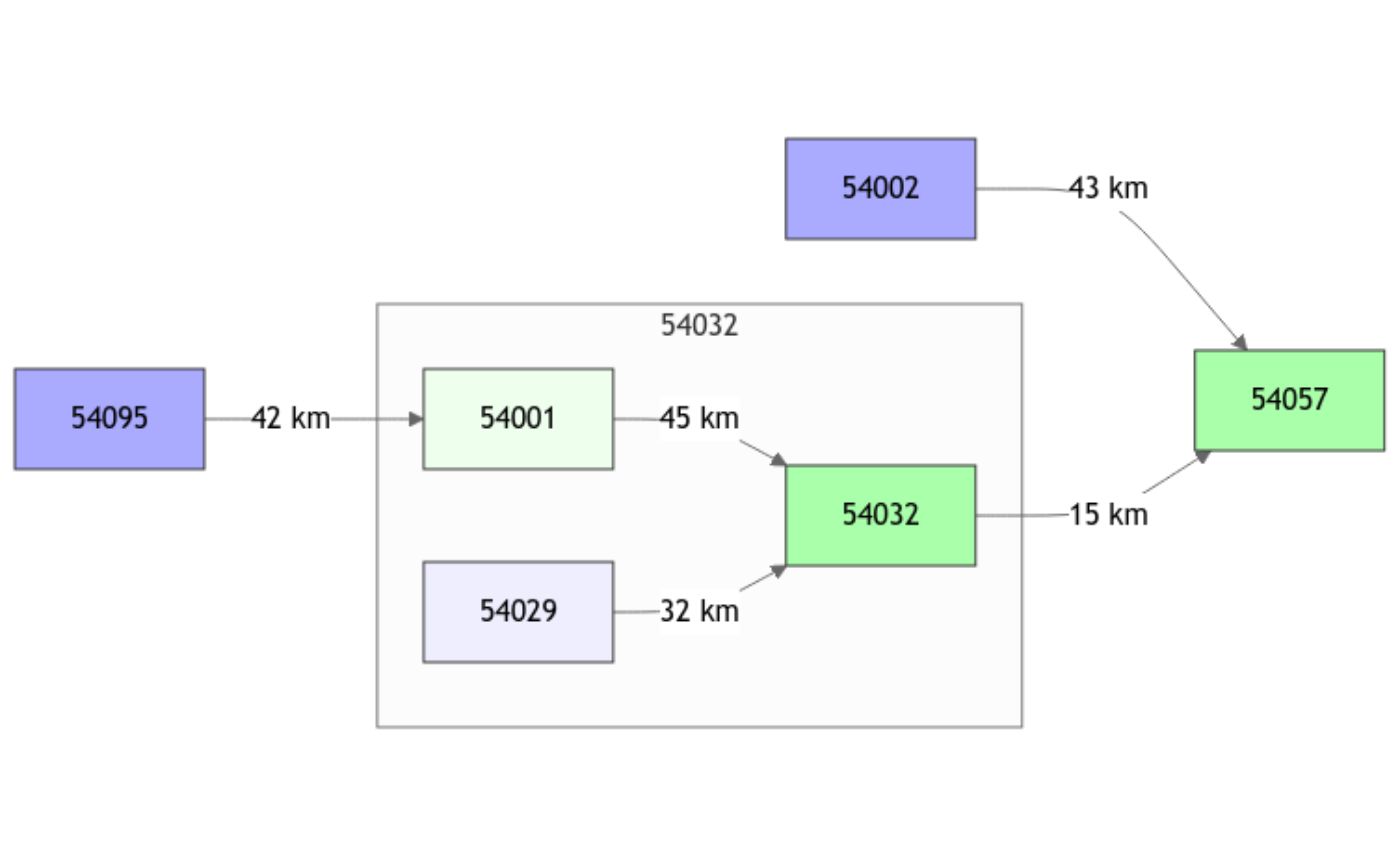
####################################################################
# Severn network with an ungauged station at nodes 54029 and 54001 #
####################################################################
nodes_ungauged <- nodes
nodes_ungauged$model[nodes_ungauged$gauge_id %in% c("54029", "54001")] <- "Ungauged"
# By default the first gauged node at downstream is used for parameter calibration (54032)
# Add a `donor`column for defining manually an upstream or sibling donor
nodes_ungauged$donor <- as.character(NA)
nodes_ungauged$donor[nodes_ungauged$id == "54001"] <- "54095"
griwrm_ungauged <- CreateGRiwrm(nodes_ungauged, rename_columns)
#> Ungauged node '54001' automatically gets the node '54032' as parameter donor
#> Ungauged node '54029' automatically gets the node '54032' as parameter donor
griwrm_ungauged
#> id down length area model donor
#> 4 54095 54001 42 3722.68 RunModel_GR4J 54095
#> 5 54002 54057 43 2207.95 RunModel_GR4J 54002
#> 3 54001 54032 45 4329.90 Ungauged 54032
#> 6 54029 54032 32 1483.65 Ungauged 54032
#> 2 54032 54057 15 6864.88 RunModel_GR4J 54032
#> 1 54057 <NA> NA 9885.46 RunModel_GR4J 54057
# Network diagram with gauged nodes of vivid color, and ungauged nodes of dull color
# \dontrun{
plot(griwrm_ungauged)
# }
####################################################################
# Severn network with an ungauged station at nodes 54029 and 54001 #
####################################################################
nodes_ungauged <- nodes
nodes_ungauged$model[nodes_ungauged$gauge_id %in% c("54029", "54001")] <- "Ungauged"
# By default the first gauged node at downstream is used for parameter calibration (54032)
# Add a `donor`column for defining manually an upstream or sibling donor
nodes_ungauged$donor <- as.character(NA)
nodes_ungauged$donor[nodes_ungauged$id == "54001"] <- "54095"
griwrm_ungauged <- CreateGRiwrm(nodes_ungauged, rename_columns)
#> Ungauged node '54001' automatically gets the node '54032' as parameter donor
#> Ungauged node '54029' automatically gets the node '54032' as parameter donor
griwrm_ungauged
#> id down length area model donor
#> 4 54095 54001 42 3722.68 RunModel_GR4J 54095
#> 5 54002 54057 43 2207.95 RunModel_GR4J 54002
#> 3 54001 54032 45 4329.90 Ungauged 54032
#> 6 54029 54032 32 1483.65 Ungauged 54032
#> 2 54032 54057 15 6864.88 RunModel_GR4J 54032
#> 1 54057 <NA> NA 9885.46 RunModel_GR4J 54057
# Network diagram with gauged nodes of vivid color, and ungauged nodes of dull color
# \dontrun{
plot(griwrm_ungauged)
 # }
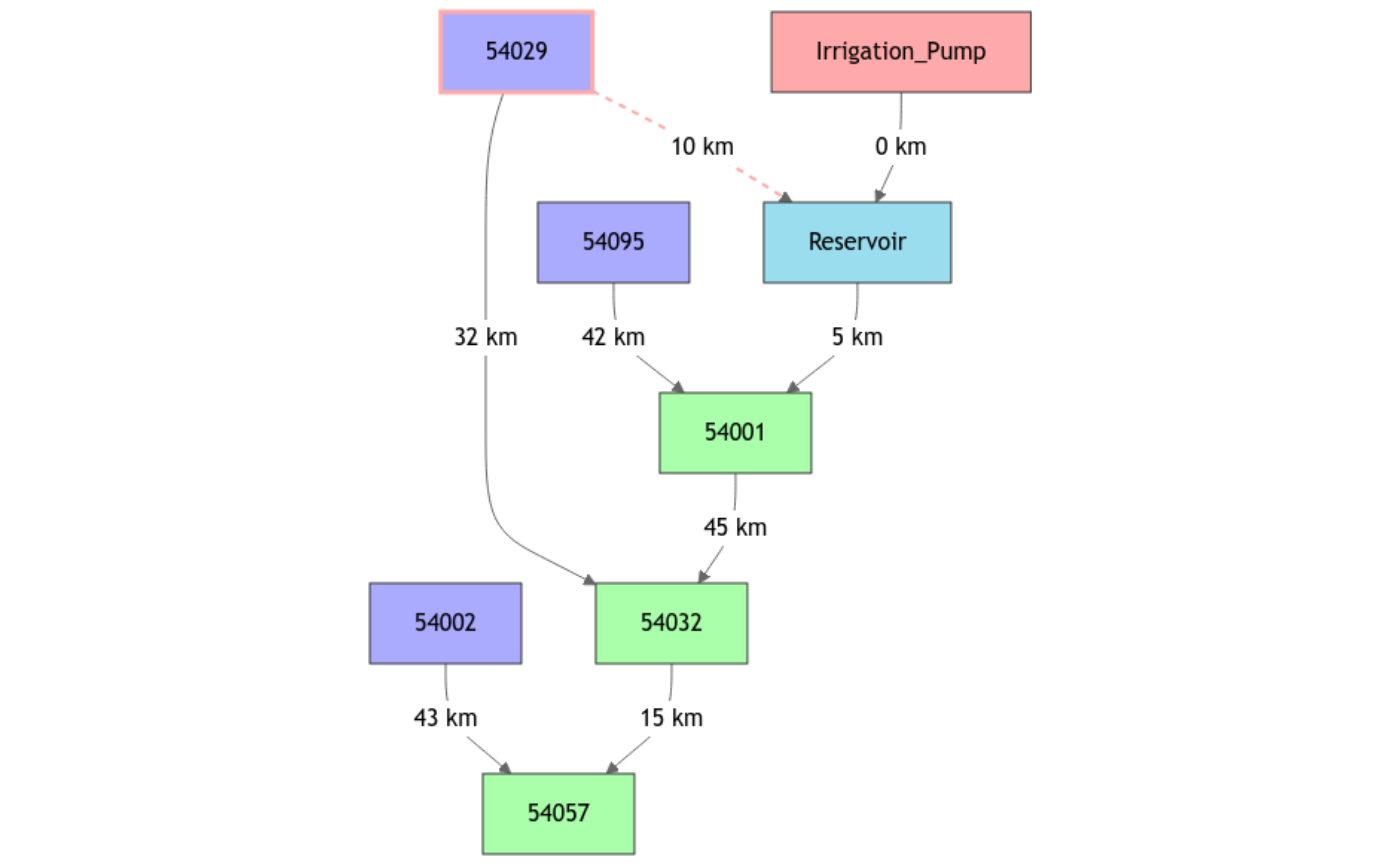
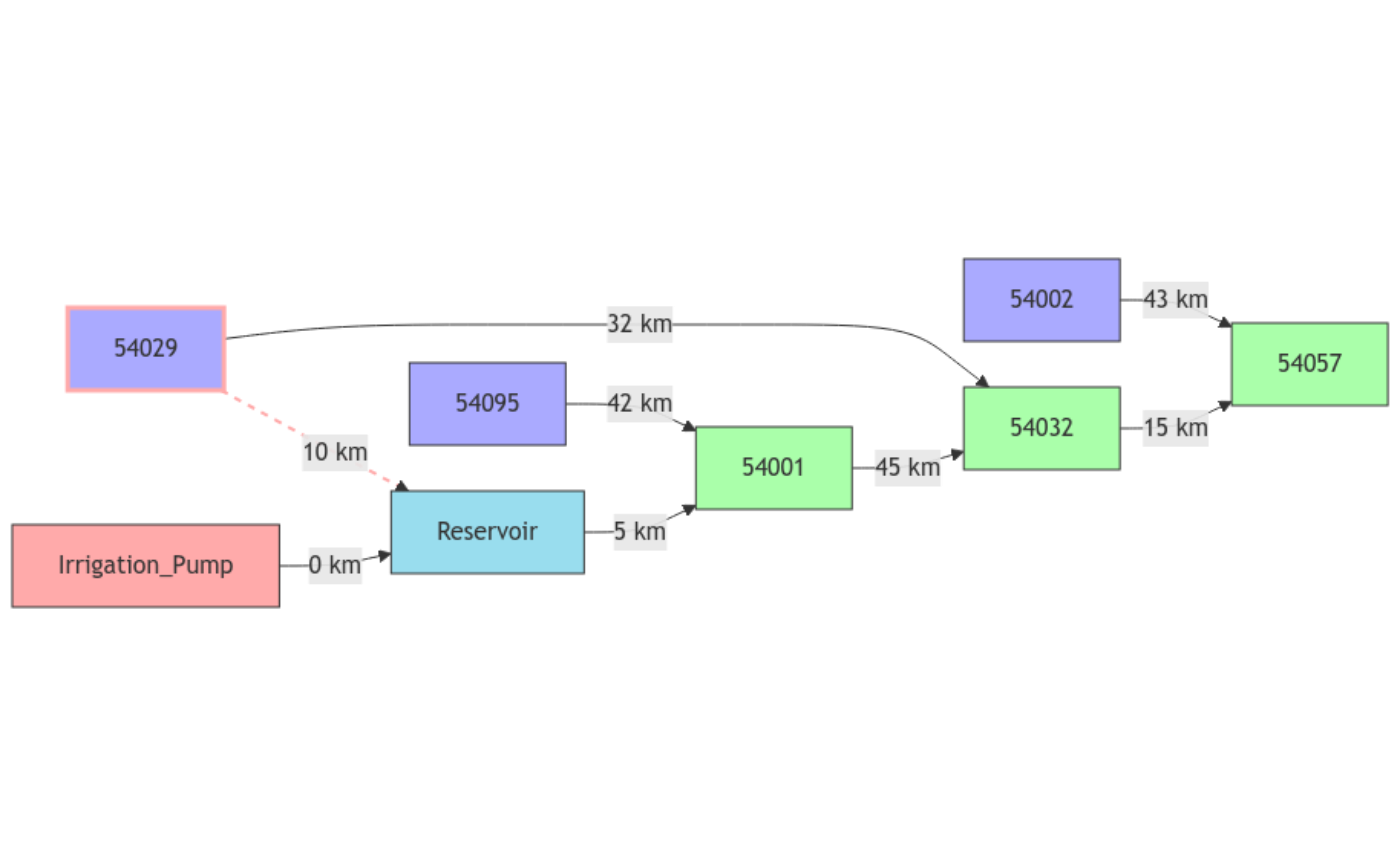
###########################################################
# Severn network with a Diversion on the node "54029" #
# to a reservoir which transfer flows to the node "54001" #
# and a withdrawal on the reservoir #
###########################################################
nodes_div <- nodes[, c("gauge_id", "downstream_id", "distance_downstream", "model", "area")]
nodes_div <- rbind(
nodes_div,
data.frame(gauge_id = c("54029" , "Reservoir" , "Irrigation_Pump"),
downstream_id = c("Reservoir", "54001" , "Reservoir" ),
distance_downstream = c(10 , 5 , 0 ),
model = c("Diversion", "RunModel_Reservoir", NA ),
area = c(NA , NA , NA))
)
griwrm_div <- CreateGRiwrm(nodes_div, rename_columns)
# Network diagram figures Diversion node by a red frame and a red arrow
# \dontrun{
plot(griwrm_div, orientation = "TB")
# }
###########################################################
# Severn network with a Diversion on the node "54029" #
# to a reservoir which transfer flows to the node "54001" #
# and a withdrawal on the reservoir #
###########################################################
nodes_div <- nodes[, c("gauge_id", "downstream_id", "distance_downstream", "model", "area")]
nodes_div <- rbind(
nodes_div,
data.frame(gauge_id = c("54029" , "Reservoir" , "Irrigation_Pump"),
downstream_id = c("Reservoir", "54001" , "Reservoir" ),
distance_downstream = c(10 , 5 , 0 ),
model = c("Diversion", "RunModel_Reservoir", NA ),
area = c(NA , NA , NA))
)
griwrm_div <- CreateGRiwrm(nodes_div, rename_columns)
# Network diagram figures Diversion node by a red frame and a red arrow
# \dontrun{
plot(griwrm_div, orientation = "TB")
 # }
# It's also possible to custom the diagram's look with mermaid directives
# (See details in plot.GRiwrm help topic)
# \dontrun{
plot(
griwrm_div,
header = "%%{init: {'flowchart': {'nodeSpacing': 30, 'rankSpacing': 30, 'curve': 'linear'}}}%%"
)
# }
# It's also possible to custom the diagram's look with mermaid directives
# (See details in plot.GRiwrm help topic)
# \dontrun{
plot(
griwrm_div,
header = "%%{init: {'flowchart': {'nodeSpacing': 30, 'rankSpacing': 30, 'curve': 'linear'}}}%%"
)
 # }
# }