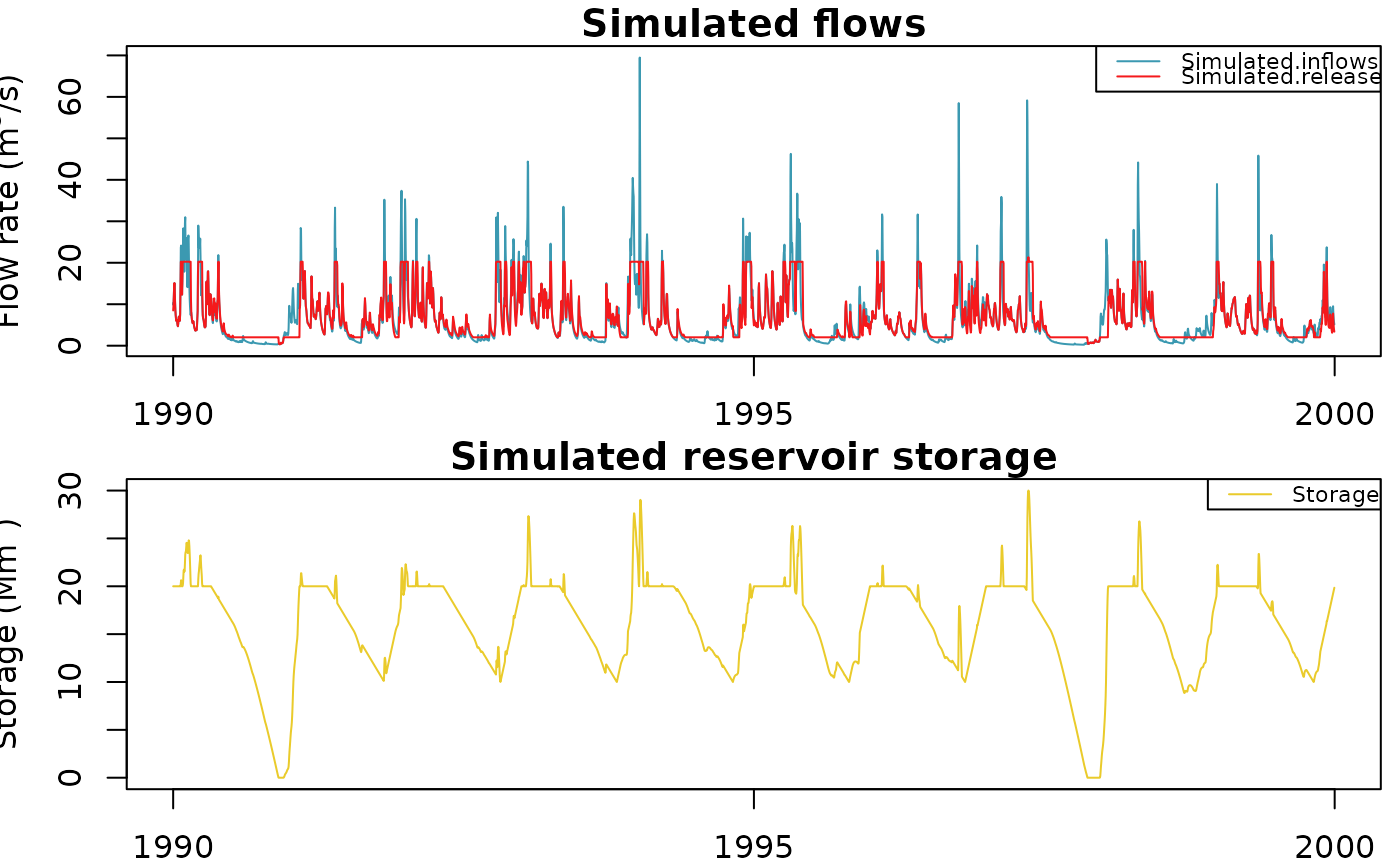
Plot simulated reservoir volume, inflows and released flows time series on a reservoir node
Source:R/plot.OutputsModelReservoir.R
plot.OutputsModelReservoir.RdPlot simulated reservoir volume, inflows and released flows time series on a reservoir node
Usage
# S3 method for class 'OutputsModelReservoir'
plot(x, Qobs = NULL, Vobs = NULL, which = NULL, ...)
Arguments
- x
Object returned by RunModel_Reservoir
- Qobs
(optional) numeric time series of targeted released flow [m3/time step]
- Vobs
(optional) numeric time series of observed or targeted volume curve [m3]
- which
Not used (for compatibility with airGR::plot.OutputsModel)
- ...
Further arguments passed to plot.Qm3s
Examples
#######################################################
# Daily time step simulation of a reservoir filled by #
# one catchment supplying a constant released flow #
#######################################################
library(airGRiwrm)
data(L0123001)
# Inflows comes from a catchment of 360 km² modeled with GR4J
# The reservoir receives directly the inflows
db <- data.frame(
id = c(BasinInfo$BasinCode, "Reservoir"),
length = c(0, NA),
down = c("Reservoir", NA),
area = c(BasinInfo$BasinArea, NA),
model = c("RunModel_GR4J", "RunModel_Reservoir"),
stringsAsFactors = FALSE
)
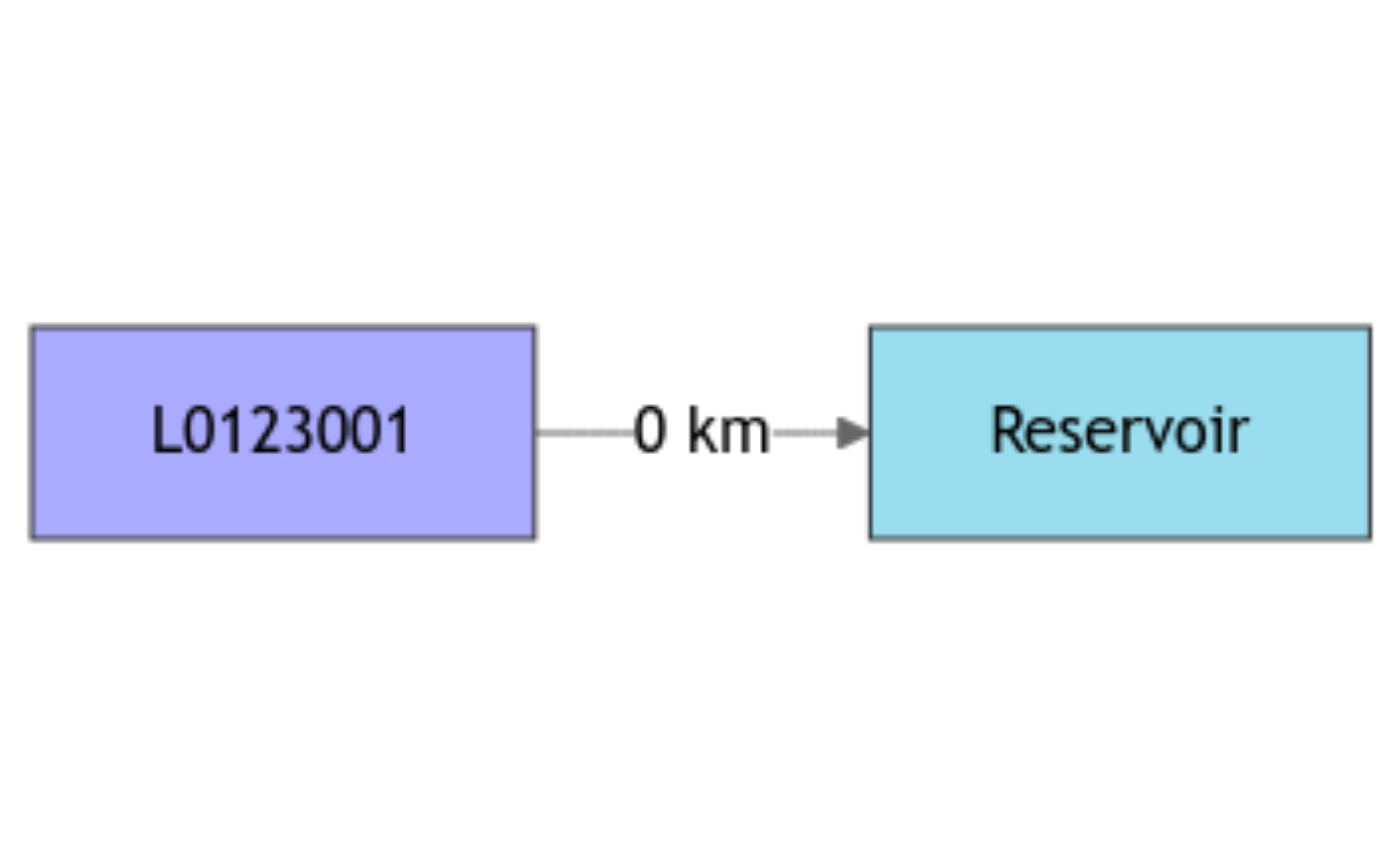
griwrm <- CreateGRiwrm(db)
if (interactive()) {
plot(griwrm)
}
# This catchment inflows a reservoir of maximum capacity Vmax
Vmax <- 4E6 # in m3
# Formatting of GR4J inputs for airGRiwrm (matrix or data.frame with one
# column by sub-basin and node IDs as column names)
Precip <- matrix(BasinObs$P, ncol = 1)
colnames(Precip) <- BasinInfo$BasinCode
PotEvap <- matrix(BasinObs$E, ncol = 1)
colnames(PotEvap) <- BasinInfo$BasinCode
# We propose to compute the constant released flow from
# the Q20 of the natural flow
# The value is in m3 by time step (day)
(Qrelease <- quantile(BasinObs$Qls, na.rm = TRUE, probs = 0.2) / 1000 * 86400)
#> 20%
#> 114393.6
# Formatting of reservoir released flow inputs for airGRiwrm (matrix or data.frame
# with one column by node and node IDs as column names)
Qrelease <- data.frame(Reservoir = rep(Qrelease, length(BasinObs$DatesR)))
InputsModel <- CreateInputsModel(
griwrm,
DatesR = BasinObs$DatesR,
Precip = Precip,
PotEvap = PotEvap,
Qrelease = Qrelease
)
#> CreateInputsModel.GRiwrm: Processing sub-basin L0123001...
#> CreateInputsModel.GRiwrm: Processing sub-basin Reservoir...
## run period selection
Ind_Run <- seq(
which(format(BasinObs$DatesR, format = "%Y-%m-%d") == "1990-01-01"),
which(format(BasinObs$DatesR, format = "%Y-%m-%d") == "1999-12-31")
)
# Creation of the GRiwmRunOptions object with the initial states of the reservoir set to 0 (empty reservoir)
RunOptions <- CreateRunOptions(
InputsModel,
IndPeriod_Run = Ind_Run,
IndPeriod_WarmUp = seq.int(Ind_Run[1] - 365, length.out = 365),
IniStates = list(Reservoir = c("Reservoir.V" = 0))
)
# calibration criterion: preparation of the InputsCrit object
Qobs <- data.frame("L0123001" = BasinObs$Qmm[Ind_Run])
InputsCrit <- CreateInputsCrit(
InputsModel,
ErrorCrit_KGE2,
RunOptions = RunOptions,
Obs = Qobs
)
# preparation of CalibOptions object with fixed parameters for the reservoir
# The capacity of the reservoir is set to Vmax and the inflow celerity is 0.5 m/s.
CalibOptions <- CreateCalibOptions(
InputsModel,
FixedParam = list(Reservoir = c(Vmax = Vmax, celerity = 0.5))
)
OC <- Calibration(
InputsModel = InputsModel,
RunOptions = RunOptions,
InputsCrit = InputsCrit,
CalibOptions = CalibOptions
)
#> Calibration.GRiwrmInputsModel: Processing sub-basin 'L0123001'...
#> Grid-Screening in progress (
#> 0%
#> 20%
#> 40%
#> 60%
#> 80%
#> 100%)
#> Screening completed (81 runs)
#> Param = 169.017, -0.020, 83.096, 1.944
#> Crit. KGE2[Q] = 0.8231
#> Steepest-descent local search in progress
#> Calibration completed (28 iterations, 291 runs)
#> Param = 147.886, 0.347, 58.983, 2.345
#> Crit. KGE2[Q] = 0.8548
#> Calibration.GRiwrmInputsModel: Processing sub-basin 'Reservoir'...
#> Parameters already fixed - no need for calibration
#> Param = 4000000.000, 0.500
# Model parameters
Param <- extractParam(OC)
str(Param)
#> List of 2
#> $ L0123001 : num [1:4] 147.886 0.347 58.983 2.345
#> $ Reservoir: Named num [1:2] 4e+06 5e-01
#> ..- attr(*, "names")= chr [1:2] "Vmax" "celerity"
# Running simulation
OutputsModel <- RunModel(InputsModel, RunOptions, Param)
#> RunModel.GRiwrmInputsModel: Processing sub-basin L0123001...
#> RunModel.GRiwrmInputsModel: Processing sub-basin Reservoir...
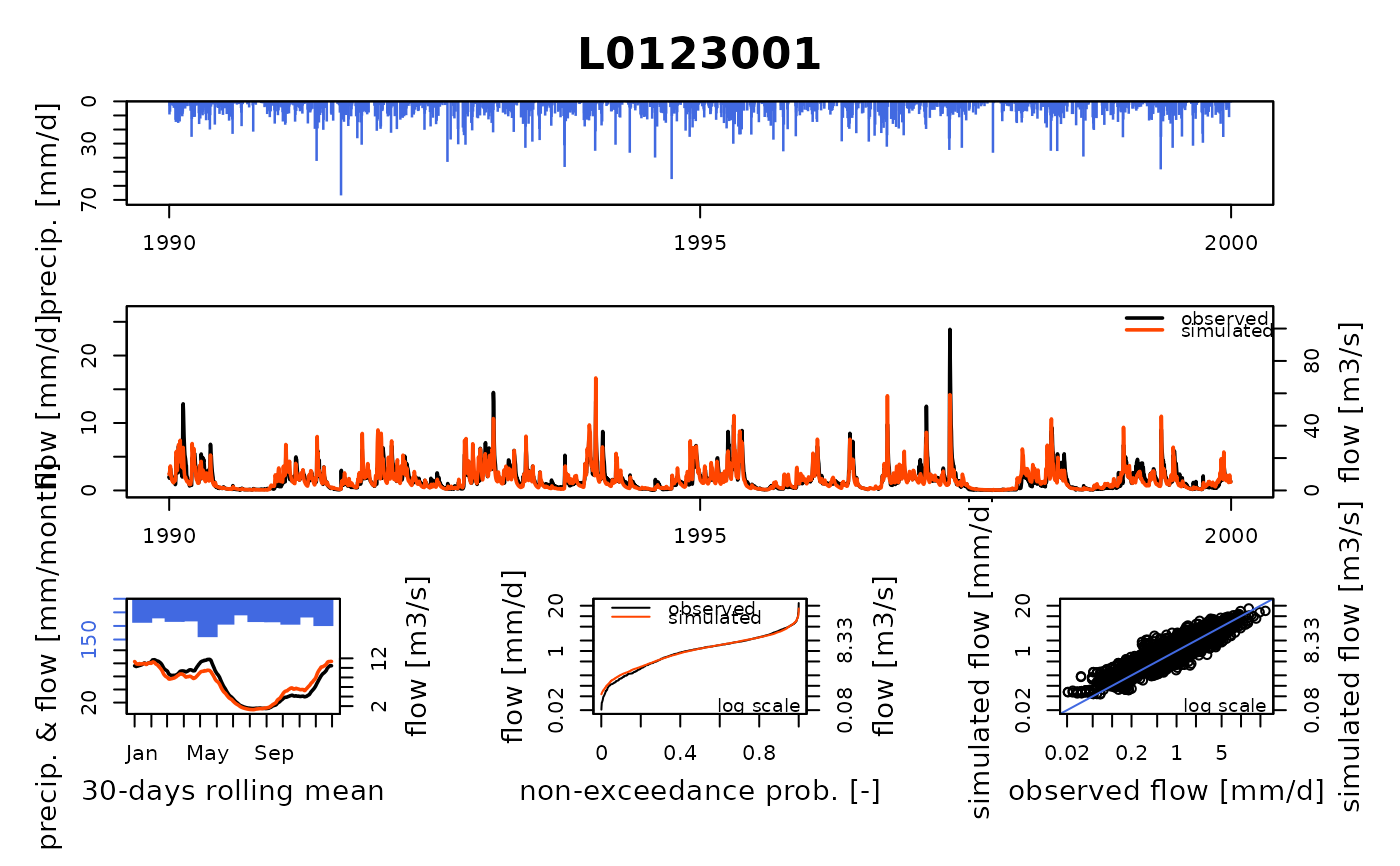
# Plot the simulated flows and volumes on all nodes
Qobs <- cbind(BasinObs$Qmm[Ind_Run], Qrelease[Ind_Run, ])
colnames(Qobs) <- griwrm$id
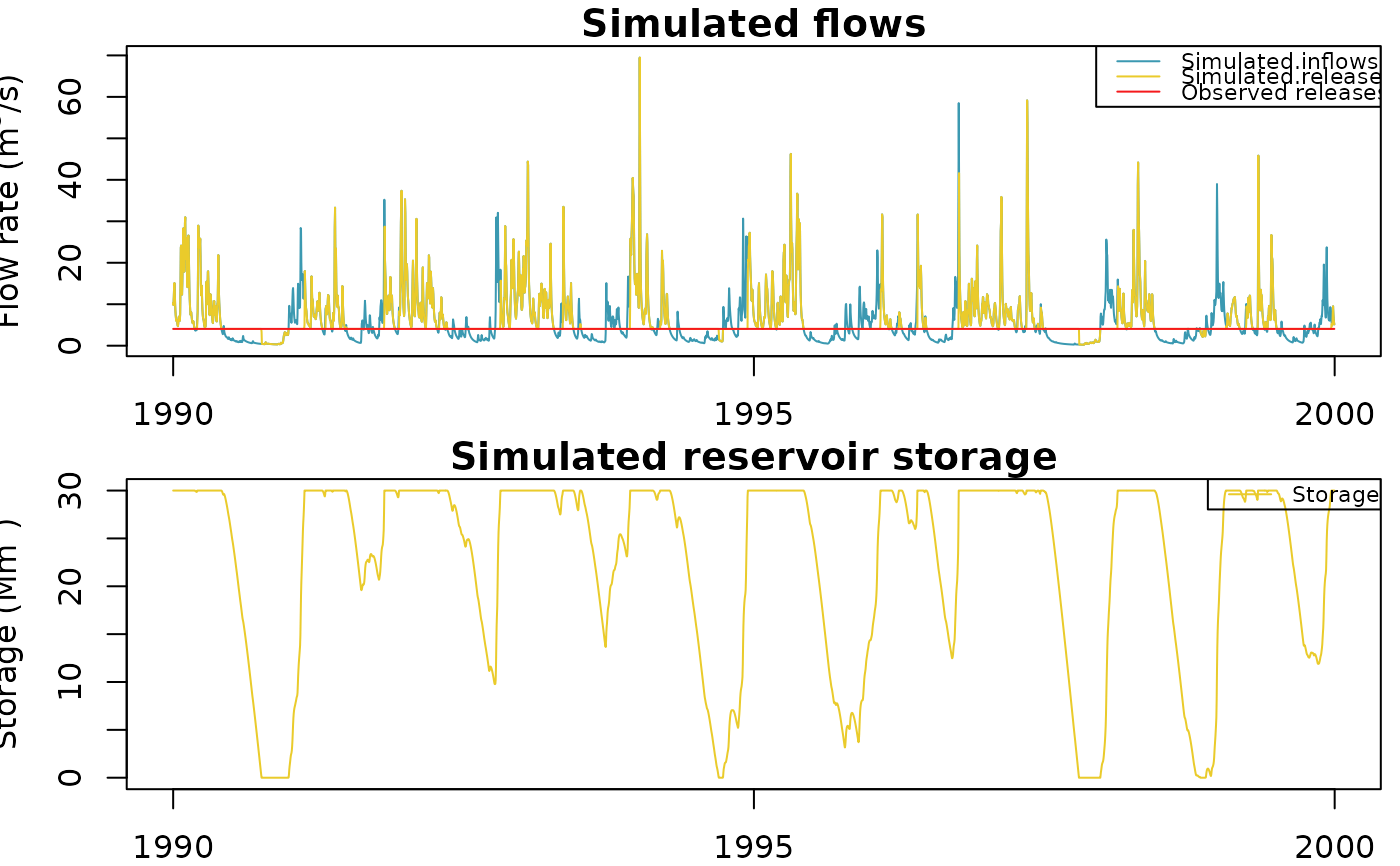
plot(OutputsModel, Qobs = Qobs)
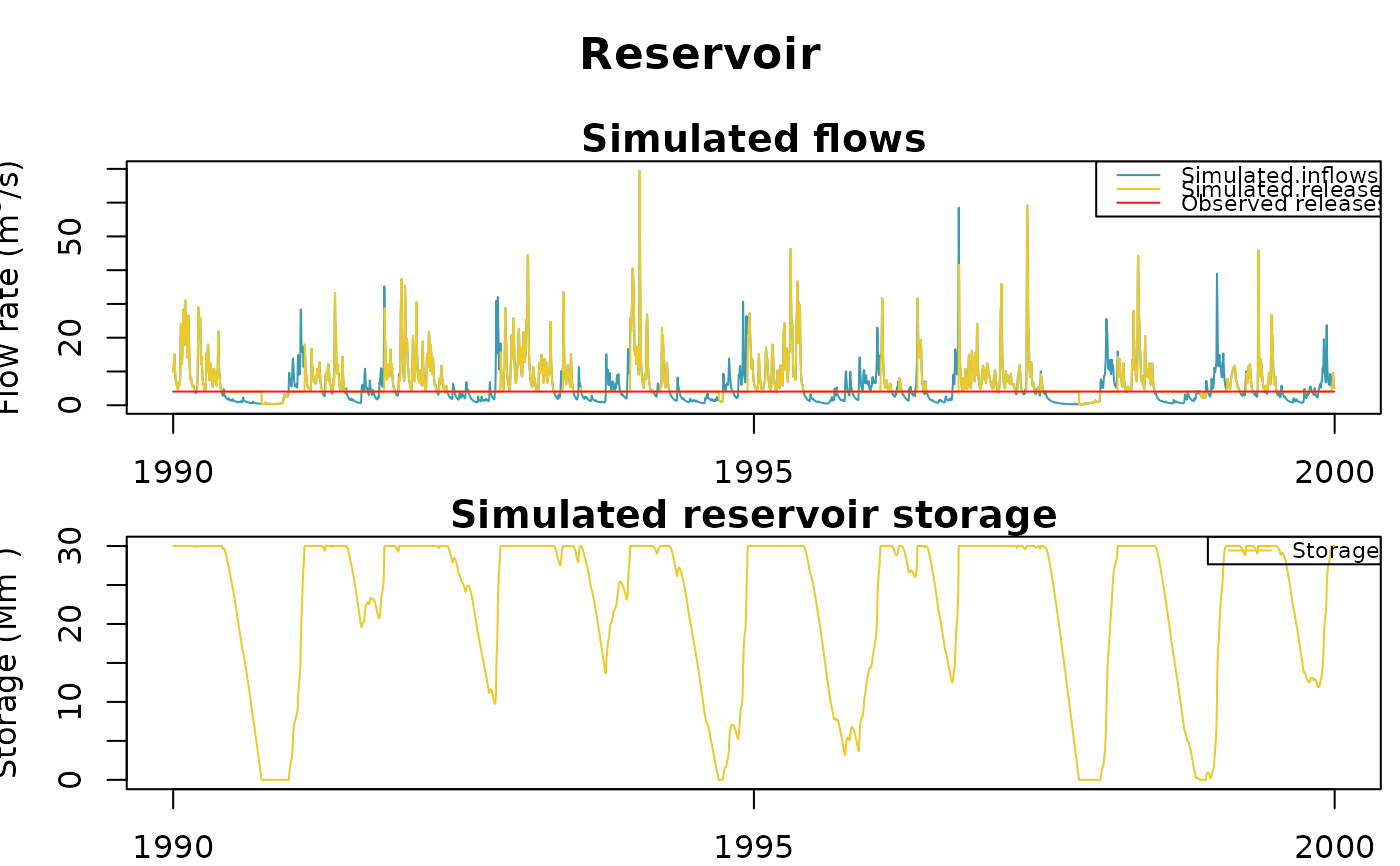
 # The plot for the reservoir can also be plotted alone
plot(OutputsModel$Reservoir, Qobs = Qobs[, "Reservoir"])
# The plot for the reservoir can also be plotted alone
plot(OutputsModel$Reservoir, Qobs = Qobs[, "Reservoir"])
 #######################################################
# Daily time step simulation of a reservoir tracking #
# an objective filling curve using a local regulation #
#######################################################
# The objective here is to simulate the same reservoir as above
# but with new rules:
# - A minimum flow downstream the reservoir defined as:
(Qmin <- Qrelease[1, ])
#> [1] 114393.6
# - A maximum release flow of 20 m3/s for flood mitigation
(Qmax <- 20 * 86400)
#> [1] 1728000
# - An annual objective filling curve managing floods and droughts by
# trying to keep the reservoir volume between 2 and 8 Mm3:
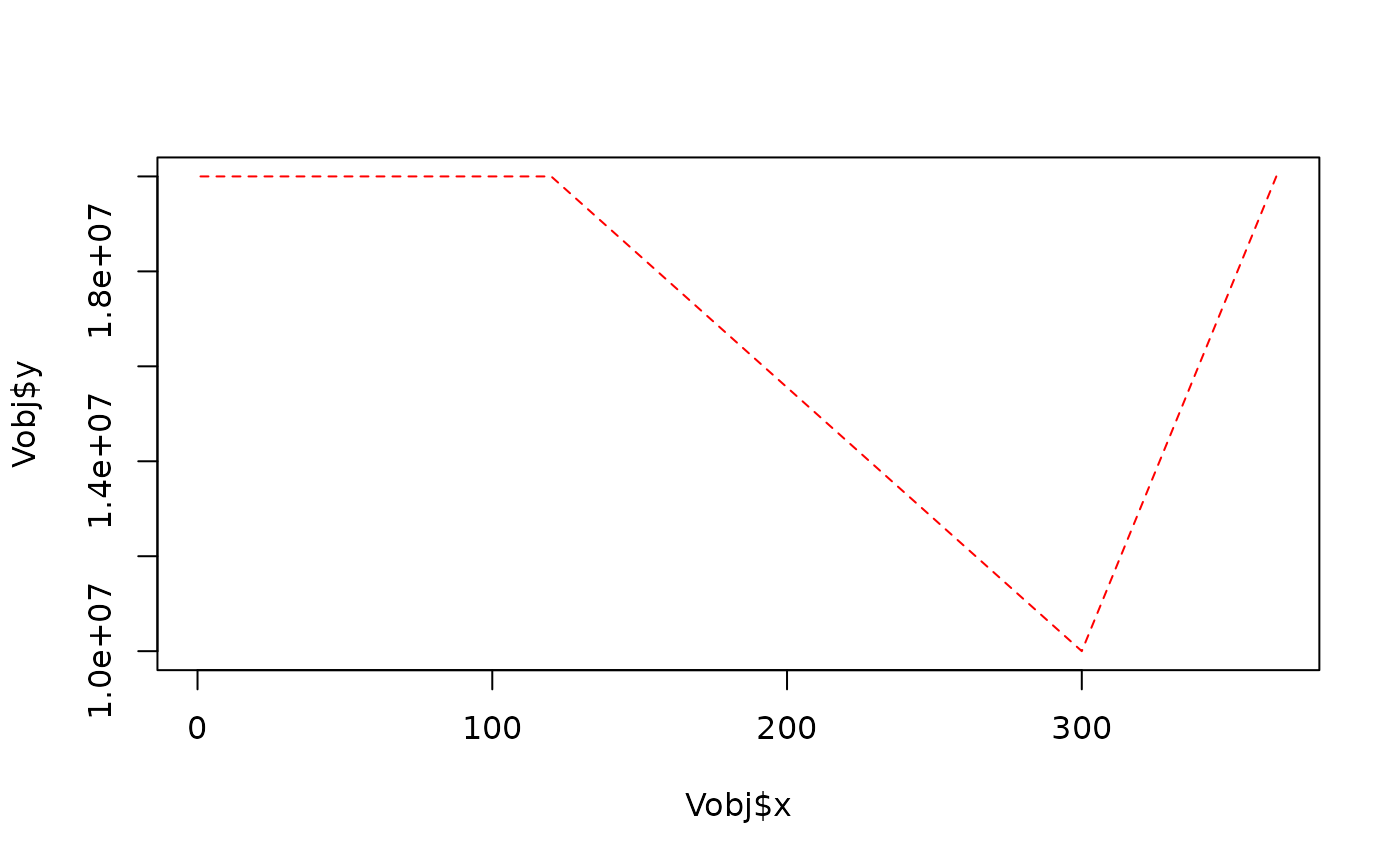
Vobj <- approx(c(1, 150, 300, 366), c(1E6, 3.5E6, 0.5E6, 1E6), seq(366))
plot(Vobj, type = "l", col = "red", lty = 2)
#######################################################
# Daily time step simulation of a reservoir tracking #
# an objective filling curve using a local regulation #
#######################################################
# The objective here is to simulate the same reservoir as above
# but with new rules:
# - A minimum flow downstream the reservoir defined as:
(Qmin <- Qrelease[1, ])
#> [1] 114393.6
# - A maximum release flow of 20 m3/s for flood mitigation
(Qmax <- 20 * 86400)
#> [1] 1728000
# - An annual objective filling curve managing floods and droughts by
# trying to keep the reservoir volume between 2 and 8 Mm3:
Vobj <- approx(c(1, 150, 300, 366), c(1E6, 3.5E6, 0.5E6, 1E6), seq(366))
plot(Vobj, type = "l", col = "red", lty = 2)
 # The regulation function takes InputsModel of the reservoir node and the
# global GRiwrm OutputsModel as arguments and returns a modified
# InputsModel used by RunModel_Reservoir afterward
fun_factory_Regulation_Reservoir <- function(Vini, Vobj, Qmin, Qmax, Vmax) {
function(InputsModel, RunOptions, OutputsModel, env) {
# Release flow time series initialisation
Qrelease <- rep(0, length(InputsModel$DatesR))
# Build inflows time series from upstream Qsim (warmup & run)
Qinflows <- Qrelease
IPR_all <- c(RunOptions$IndPeriod_WarmUp, RunOptions$IndPeriod_Run)
Qinflows[IPR_all] <- c(
OutputsModel$L0123001$RunOptions$WarmUpQsim_m3,
OutputsModel$L0123001$Qsim_m3
)
# Reservoir volume initialisation
V <- Vini
# Loop over simulation time steps (warmup & run periods)
for (ts in IPR_all) {
# Update reservoir volume with inflows
V <- V + Qinflows[ts]
# Rule #1: follow the objective filling curve (lower priority)
j <- as.numeric(format(InputsModel$DatesR[ts], "%j"))
Vobj_ts <- approx(Vobj, xout = j)$y
Qrelease[ts] <- V - Vobj_ts
# Rule #2: Release cannot be less than Qmin
Qrelease[ts] <- max(Qmin, Qrelease[ts])
# Rule #3: Release cannot be more than Qmax
Qrelease[ts] <- min(Qmax, Qrelease[ts])
# Update reservoir volume after release
V <- V - Qrelease[ts]
# Rule #4: hard constraints on the reservoir (full or empty?)
if (V < 0) {
Qrelease[ts] <- Qrelease[ts] + V
V <- 0
}
V <- min(V, Vmax)
}
InputsModel$Qrelease <- Qrelease
return(InputsModel)
}
}
# A call to fun_factory_Regulation_Reservoir returns the regulation
# function with the parameters Qmin, Qmax, Vobj enclosed in the environment
# of the function
Regulation_Reservoir <-
fun_factory_Regulation_Reservoir(
RunOptions$Reservoir$IniStates,
Vobj,
Qmin,
Qmax,
Vmax
)
# Then we need to update InputsModel in order to take into account the regulation
# function instead of predefined Qrelease in the previous study case
IM_reg <- CreateInputsModel(
griwrm,
DatesR = BasinObs$DatesR,
Precip = Precip,
PotEvap = PotEvap,
Qrelease = Qrelease,
FUN_REGUL = list(Reservoir = Regulation_Reservoir)
)
#> CreateInputsModel.GRiwrm: Processing sub-basin L0123001...
#> CreateInputsModel.GRiwrm: Processing sub-basin Reservoir...
# And we can finally run the simulation!
OM_reg <- RunModel(IM_reg, RunOptions, Param)
#> RunModel.GRiwrmInputsModel: Processing sub-basin L0123001...
#> RunModel.GRiwrmInputsModel: Processing sub-basin Reservoir...
# And plot the new result
plot(OM_reg$Reservoir, Vobs = Vobj$y[lubridate::yday(OM_reg$Reservoir$DatesR)])
# The regulation function takes InputsModel of the reservoir node and the
# global GRiwrm OutputsModel as arguments and returns a modified
# InputsModel used by RunModel_Reservoir afterward
fun_factory_Regulation_Reservoir <- function(Vini, Vobj, Qmin, Qmax, Vmax) {
function(InputsModel, RunOptions, OutputsModel, env) {
# Release flow time series initialisation
Qrelease <- rep(0, length(InputsModel$DatesR))
# Build inflows time series from upstream Qsim (warmup & run)
Qinflows <- Qrelease
IPR_all <- c(RunOptions$IndPeriod_WarmUp, RunOptions$IndPeriod_Run)
Qinflows[IPR_all] <- c(
OutputsModel$L0123001$RunOptions$WarmUpQsim_m3,
OutputsModel$L0123001$Qsim_m3
)
# Reservoir volume initialisation
V <- Vini
# Loop over simulation time steps (warmup & run periods)
for (ts in IPR_all) {
# Update reservoir volume with inflows
V <- V + Qinflows[ts]
# Rule #1: follow the objective filling curve (lower priority)
j <- as.numeric(format(InputsModel$DatesR[ts], "%j"))
Vobj_ts <- approx(Vobj, xout = j)$y
Qrelease[ts] <- V - Vobj_ts
# Rule #2: Release cannot be less than Qmin
Qrelease[ts] <- max(Qmin, Qrelease[ts])
# Rule #3: Release cannot be more than Qmax
Qrelease[ts] <- min(Qmax, Qrelease[ts])
# Update reservoir volume after release
V <- V - Qrelease[ts]
# Rule #4: hard constraints on the reservoir (full or empty?)
if (V < 0) {
Qrelease[ts] <- Qrelease[ts] + V
V <- 0
}
V <- min(V, Vmax)
}
InputsModel$Qrelease <- Qrelease
return(InputsModel)
}
}
# A call to fun_factory_Regulation_Reservoir returns the regulation
# function with the parameters Qmin, Qmax, Vobj enclosed in the environment
# of the function
Regulation_Reservoir <-
fun_factory_Regulation_Reservoir(
RunOptions$Reservoir$IniStates,
Vobj,
Qmin,
Qmax,
Vmax
)
# Then we need to update InputsModel in order to take into account the regulation
# function instead of predefined Qrelease in the previous study case
IM_reg <- CreateInputsModel(
griwrm,
DatesR = BasinObs$DatesR,
Precip = Precip,
PotEvap = PotEvap,
Qrelease = Qrelease,
FUN_REGUL = list(Reservoir = Regulation_Reservoir)
)
#> CreateInputsModel.GRiwrm: Processing sub-basin L0123001...
#> CreateInputsModel.GRiwrm: Processing sub-basin Reservoir...
# And we can finally run the simulation!
OM_reg <- RunModel(IM_reg, RunOptions, Param)
#> RunModel.GRiwrmInputsModel: Processing sub-basin L0123001...
#> RunModel.GRiwrmInputsModel: Processing sub-basin Reservoir...
# And plot the new result
plot(OM_reg$Reservoir, Vobs = Vobj$y[lubridate::yday(OM_reg$Reservoir$DatesR)])
 #############################################################
# Supervised reservoir management tracking an objective #
# filling curve using a PID Controller with Vsim as #
# controlled variable: Y = Reservoir$Vsim #
#############################################################
# The objective here is to use a Supervisor with a Controller
# that regulates the reservoir to follow an annual objective
# filling curve defined by Vobj.
#
# This example demonstrates the Supervisor pattern for reservoir
# regulation, where the control logic is called at each time step
# during the simulation, using actual model outputs as feedback.
#
# The key difference from the local regulation example above is that
# in the Supervisor pattern, the control function receives actual
# simulated values from the model at each step, enabling true
# closed-loop control.
# PID control logic factory:
# Creates a control function that uses Proportional-Derivative (PD)
# control to track the objective volume curve.
#
# Parameters enclosed in the function environment:
# - Vobj: objective filling curve (volume by day of year)
# - Qmin: minimum release flow (m3/day)
# - Qmax: maximum release flow (m3/day)
#
# PID formula: U = Kp * error + Kd * dError
# where:
# error = Vsim - Vobj_ts (volume error)
# dError = error - prevError (rate of change of error)
# Kp = proportional gain, Kd = derivative gain
#
# The derivative term compensates for the one-step delay in the
# Supervisor loop (Y values are from idx.output_previous) by anticipating
# the error trend and providing preemptive correction.
factoryReservoirLogic <- function(Vobj, Qmin, Qmax) {
# PID control gains
Kp <- 1 # Proportional gain: reacts to current volume error
Kd <- 1 # Derivative gain: anticipates future error trend
prevError <- 0 # Previous time step error (for derivative term)
# Control logic function called by the Supervisor at each time step
#
# Input: Y = matrix of controlled variables from the model
# Y[1] = Vsim from the Reservoir node (simulated volume)
#
# Output: U = control action (release flow to apply)
function(Y) {
# Read simulated volume from the model
Vsim <- Y[1]
# Get day-of-year for the objective curve lookup
j <- as.numeric(format(sv$ts.date, "%j"))
Vobj_ts <- approx(Vobj, xout = j)$y
# Compute volume error: positive means Vsim > Vobj (excess water)
error <- Vsim - Vobj_ts
# PD control action:
# P term: proportional to current error
# D term: proportional to error rate of change (dError)
# The D term provides preemptive correction based on error trend
dError <- error - prevError
U <- Kp * error + Kd * dError
# Store error for next time step derivative calculation
prevError <- error
# Apply physical constraints on release
U <- max(Qmin, U)
U <- min(Qmax, U)
return(U)
}
}
# Build the control logic function with parameters enclosed in environment
ReservoirLogic <- factoryReservoirLogic(
Vobj = Vobj,
Qmin = Qmin,
Qmax = Qmax
)
# Create InputsModel with zero Qrelease (will be controlled by the Controller)
QreleaseEmpty <- data.frame(Reservoir = rep(0, length(BasinObs$DatesR)))
IM_Sup <- CreateInputsModel(
griwrm,
DatesR = BasinObs$DatesR,
Precip = Precip,
PotEvap = PotEvap,
Qrelease = QreleaseEmpty
)
#> CreateInputsModel.GRiwrm: Processing sub-basin L0123001...
#> CreateInputsModel.GRiwrm: Processing sub-basin Reservoir...
# Create the Supervisor object from InputsModel
sv <- CreateSupervisor(IM_Sup)
# Create the Controller:
# Y = "Reservoir$Vsim": reads simulated volume from Reservoir node
# U = "Reservoir$Qrelease": sets release flow for Reservoir node
# FUN = ReservoirLogic: the PD control function defined above
CreateController(
sv,
ctrl.id = "ReservoirObjectiveCurve",
Y = "Reservoir$Vsim",
U = "Reservoir$Qrelease",
FUN = ReservoirLogic
)
#> The controller 'ReservoirObjectiveCurve' has been added to the supervisor
# Run options with warm-up period starting from empty reservoir
RO_Sup <- CreateRunOptions(
IM_Sup,
IndPeriod_Run = Ind_Run,
IndPeriod_WarmUp = seq.int(Ind_Run[1] - 365, length.out = 365),
IniStates = list(Reservoir = c("Reservoir.V" = 0))
)
# Run the supervised simulation
OM_Sup <- RunModel(sv, RunOptions = RO_Sup, Param = Param)
#> Processing: 0%
#> 10%
#> 20%
#> 30%
#> 40%
#> 50%
#> 60%
#> 70%
#> 80%
#> 90%
#> 100%
# Plot the supervised simulation results
# Compare Vsim with the objective filling curve
plot(
OM_Sup$Reservoir,
Vobs = Vobj$y[lubridate::yday(OM_Sup$Reservoir$DatesR)]
)
#############################################################
# Supervised reservoir management tracking an objective #
# filling curve using a PID Controller with Vsim as #
# controlled variable: Y = Reservoir$Vsim #
#############################################################
# The objective here is to use a Supervisor with a Controller
# that regulates the reservoir to follow an annual objective
# filling curve defined by Vobj.
#
# This example demonstrates the Supervisor pattern for reservoir
# regulation, where the control logic is called at each time step
# during the simulation, using actual model outputs as feedback.
#
# The key difference from the local regulation example above is that
# in the Supervisor pattern, the control function receives actual
# simulated values from the model at each step, enabling true
# closed-loop control.
# PID control logic factory:
# Creates a control function that uses Proportional-Derivative (PD)
# control to track the objective volume curve.
#
# Parameters enclosed in the function environment:
# - Vobj: objective filling curve (volume by day of year)
# - Qmin: minimum release flow (m3/day)
# - Qmax: maximum release flow (m3/day)
#
# PID formula: U = Kp * error + Kd * dError
# where:
# error = Vsim - Vobj_ts (volume error)
# dError = error - prevError (rate of change of error)
# Kp = proportional gain, Kd = derivative gain
#
# The derivative term compensates for the one-step delay in the
# Supervisor loop (Y values are from idx.output_previous) by anticipating
# the error trend and providing preemptive correction.
factoryReservoirLogic <- function(Vobj, Qmin, Qmax) {
# PID control gains
Kp <- 1 # Proportional gain: reacts to current volume error
Kd <- 1 # Derivative gain: anticipates future error trend
prevError <- 0 # Previous time step error (for derivative term)
# Control logic function called by the Supervisor at each time step
#
# Input: Y = matrix of controlled variables from the model
# Y[1] = Vsim from the Reservoir node (simulated volume)
#
# Output: U = control action (release flow to apply)
function(Y) {
# Read simulated volume from the model
Vsim <- Y[1]
# Get day-of-year for the objective curve lookup
j <- as.numeric(format(sv$ts.date, "%j"))
Vobj_ts <- approx(Vobj, xout = j)$y
# Compute volume error: positive means Vsim > Vobj (excess water)
error <- Vsim - Vobj_ts
# PD control action:
# P term: proportional to current error
# D term: proportional to error rate of change (dError)
# The D term provides preemptive correction based on error trend
dError <- error - prevError
U <- Kp * error + Kd * dError
# Store error for next time step derivative calculation
prevError <- error
# Apply physical constraints on release
U <- max(Qmin, U)
U <- min(Qmax, U)
return(U)
}
}
# Build the control logic function with parameters enclosed in environment
ReservoirLogic <- factoryReservoirLogic(
Vobj = Vobj,
Qmin = Qmin,
Qmax = Qmax
)
# Create InputsModel with zero Qrelease (will be controlled by the Controller)
QreleaseEmpty <- data.frame(Reservoir = rep(0, length(BasinObs$DatesR)))
IM_Sup <- CreateInputsModel(
griwrm,
DatesR = BasinObs$DatesR,
Precip = Precip,
PotEvap = PotEvap,
Qrelease = QreleaseEmpty
)
#> CreateInputsModel.GRiwrm: Processing sub-basin L0123001...
#> CreateInputsModel.GRiwrm: Processing sub-basin Reservoir...
# Create the Supervisor object from InputsModel
sv <- CreateSupervisor(IM_Sup)
# Create the Controller:
# Y = "Reservoir$Vsim": reads simulated volume from Reservoir node
# U = "Reservoir$Qrelease": sets release flow for Reservoir node
# FUN = ReservoirLogic: the PD control function defined above
CreateController(
sv,
ctrl.id = "ReservoirObjectiveCurve",
Y = "Reservoir$Vsim",
U = "Reservoir$Qrelease",
FUN = ReservoirLogic
)
#> The controller 'ReservoirObjectiveCurve' has been added to the supervisor
# Run options with warm-up period starting from empty reservoir
RO_Sup <- CreateRunOptions(
IM_Sup,
IndPeriod_Run = Ind_Run,
IndPeriod_WarmUp = seq.int(Ind_Run[1] - 365, length.out = 365),
IniStates = list(Reservoir = c("Reservoir.V" = 0))
)
# Run the supervised simulation
OM_Sup <- RunModel(sv, RunOptions = RO_Sup, Param = Param)
#> Processing: 0%
#> 10%
#> 20%
#> 30%
#> 40%
#> 50%
#> 60%
#> 70%
#> 80%
#> 90%
#> 100%
# Plot the supervised simulation results
# Compare Vsim with the objective filling curve
plot(
OM_Sup$Reservoir,
Vobs = Vobj$y[lubridate::yday(OM_Sup$Reservoir$DatesR)]
)