Data Explorer
ODAM: Data Explorer
Data view: The data explorer offers a complete view of all data and associated metadata. On a single page, all the information about the dataset is gathered. In addition a graph of the relationships between the datasets is provided.
- Example online : https://pmb-bordeaux.fr/dataexplorer/?ds=frim1
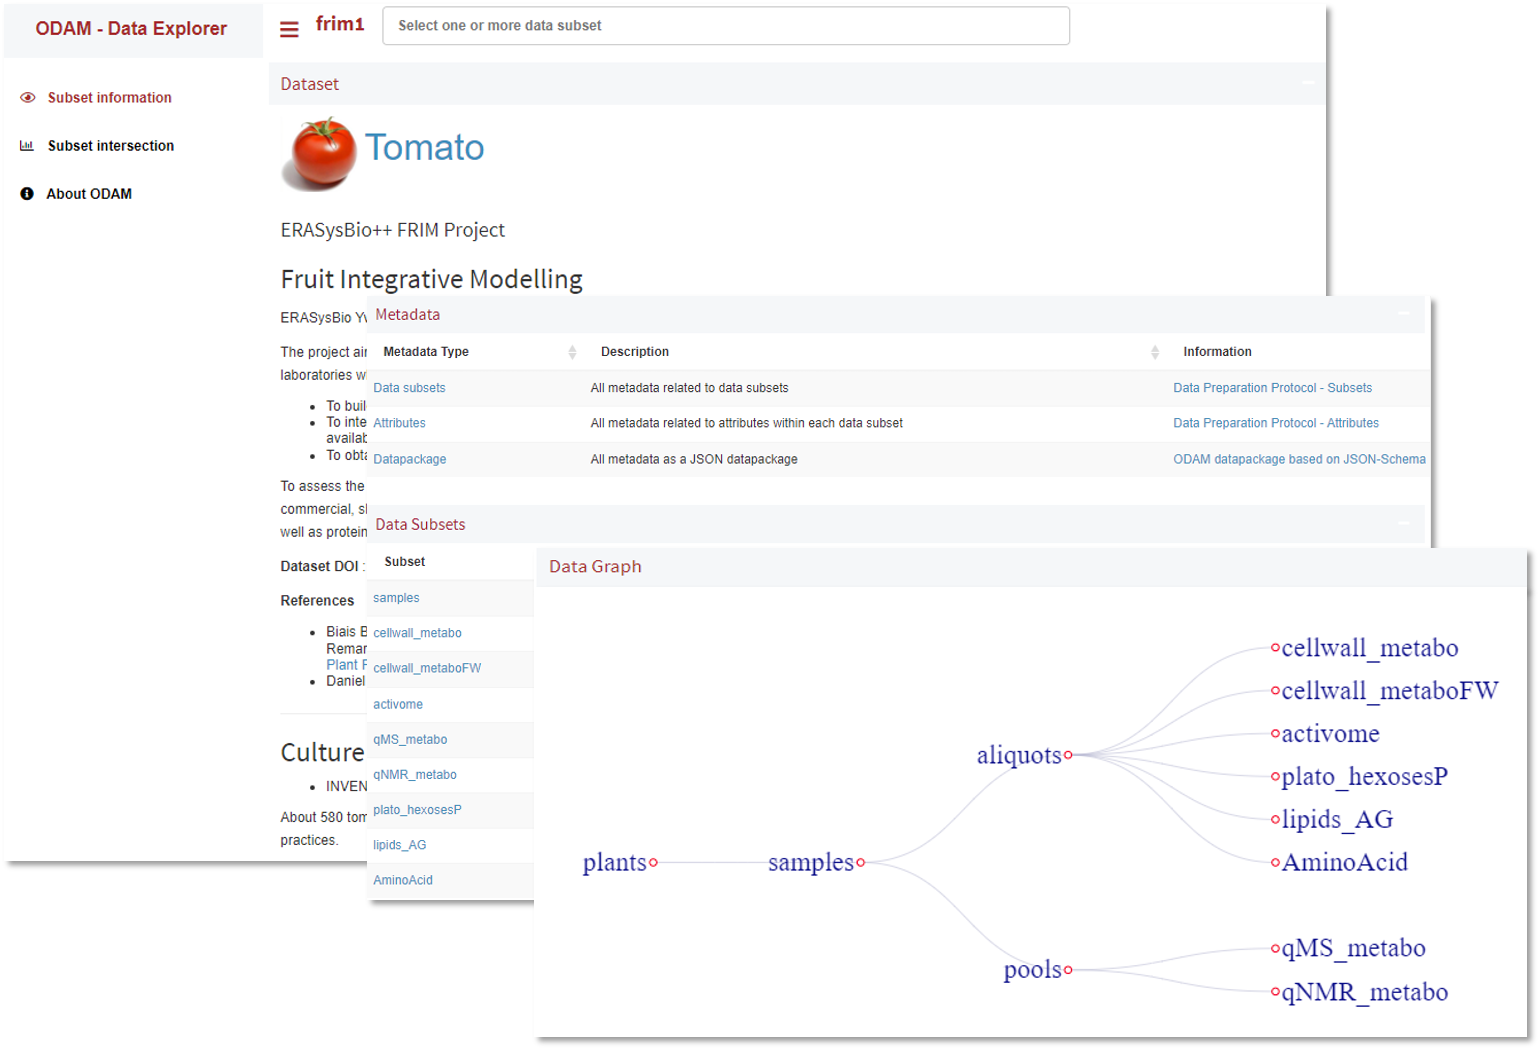
Dataset information
Data export : In the Data Explorer, it is easy to export data by selecting one or more subsets of data. The subsets will be merged based on common identifiers (e.g. samples). The resulting data table will be exported in TSV format which can be easily exploited directly in a spreadsheet or by a scripting language (R or Python).
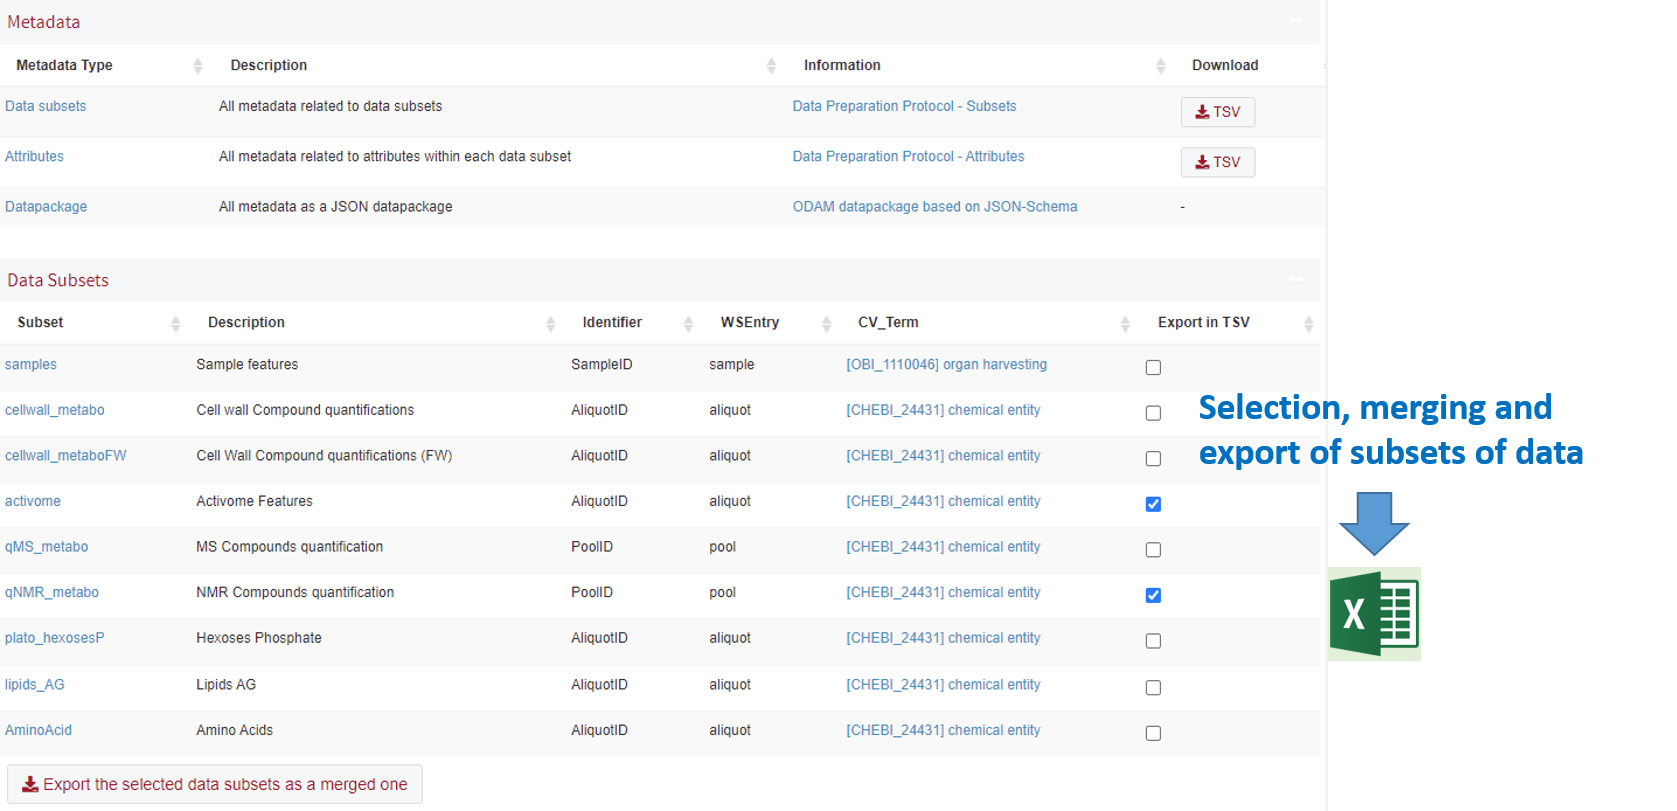
Export of datasets
Data analysis: The Data Explorer makes also data easy to explore, visualize, and subsequently to better understand the data as a whole. Explore your data in several ways according to your concerns by interacting with the graphs. For instance, univariate, bivariate, multi-univariate (volcano plot) and multivariate (PCA, ICA, t-SNE, COR, GGM) approaches have been implemented so that they are very easy to be interactively used. This is very useful in order to have a first glimpse of the data that can show trends and this allows the data to be well characterized, which is necessary to then choose how to deeply analyze them later on.
For each analysis, several possibilities can be explored by selecting many parameters and interacting with the graphs as illustrated below.
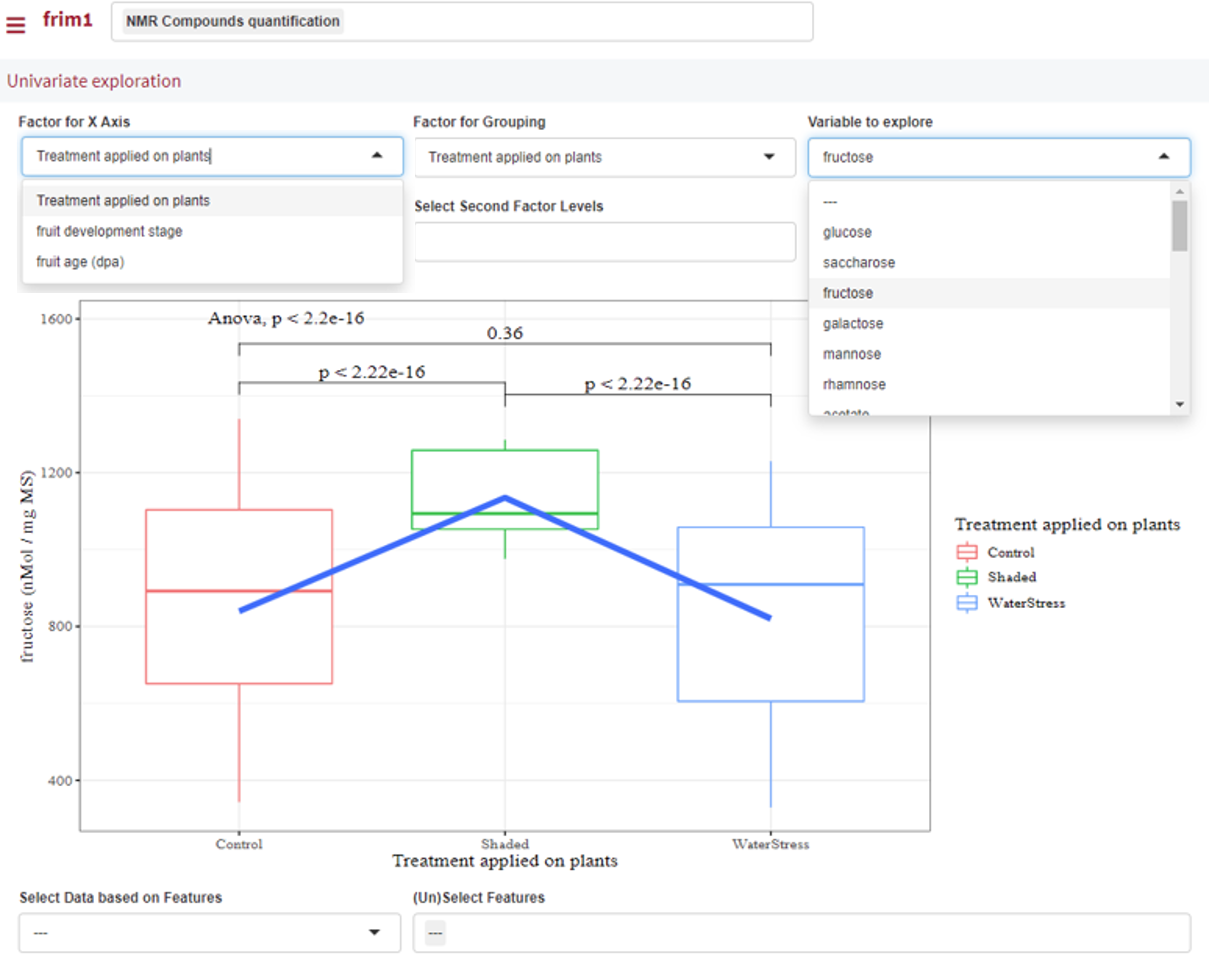
Example of univariate analysis
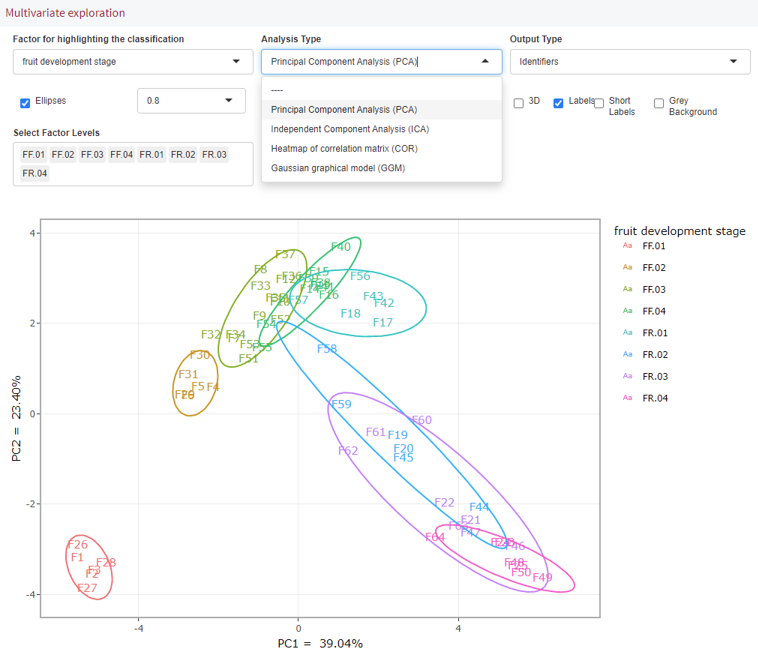
Example of multivariate analysis
Data merging: One or more subsets of data can be selected to be combined in bivariate and multivariate analysis.
Save graphics: Graphics can be easily exported as PNG/SVG files.
Parameters in the query_string : It is possible to put parameters in the query_string within the URL in order to obtain sub-parts of graphical features easily integrated in web pages (see web portal.)
Parameters that can be specified in the query-string as described below.
| Parameter | Description | Example |
|---|---|---|
| subset | selection the data subsets. | subset=activome,qNMR_metabo |
| tab | specifies which analysis tab will be selected; the possible values are: univariate, bivariate, multiunivariate and multivariate | tab=univariate |
| type | specifies which type of analysis will be selected; Only works for multivariate analysis; the possible values are: PCA,ICA,COR and GGM | type=PCA |
| fac, fac1, fac2 | specifies which fator will be selected; fac or fac1 for factor X, fac2 for factor Y depending on the analysis | fac1=stage |
| var, var1, var2 | specifies which variable will be selected; var for univariate only, var1 and var2 for bivariate only | var1=glucose&var2=fructose |
| lev1, lev2 | specifies which levels will be selected for volcano plot, i.e lev2 vs lev1 | lev1=Control&lev2=Shaded |
| frame | indicates if the main frame is displayed (default) or not | frame=off |
| fup,fdwn | indicates whether the top and bottom frames of the analysis will be displayed (by default) or not. Only works if the main frame is disabled. | fup=off |
Examples:
- Example 1 : Univariate analysis on the variable 'glucose' from the data subset 'qNMR_metabo' based on the factor 'stage'; No main frame and no bottom frame.
- Query string: ?ds=frim1&subset=qNMR_metabo&tab=univariate&fac=stage&var=glucose&frame=off&fdwn=off
- Example 2 : PCA analysis on the data subset 'activome' based on the factor 'stage'; No main frame and no top and bottom frames.
- Query string: ?ds=frim1&subset=activome&tab=multivariate&type=PCA&fac=stage&frame=off&fup=off&fdwn=off
Data exporting into a spreadsheet : Finally, an interesting possibility is that you can make a selection of a subset of data and then export it directly into your spreadsheet.
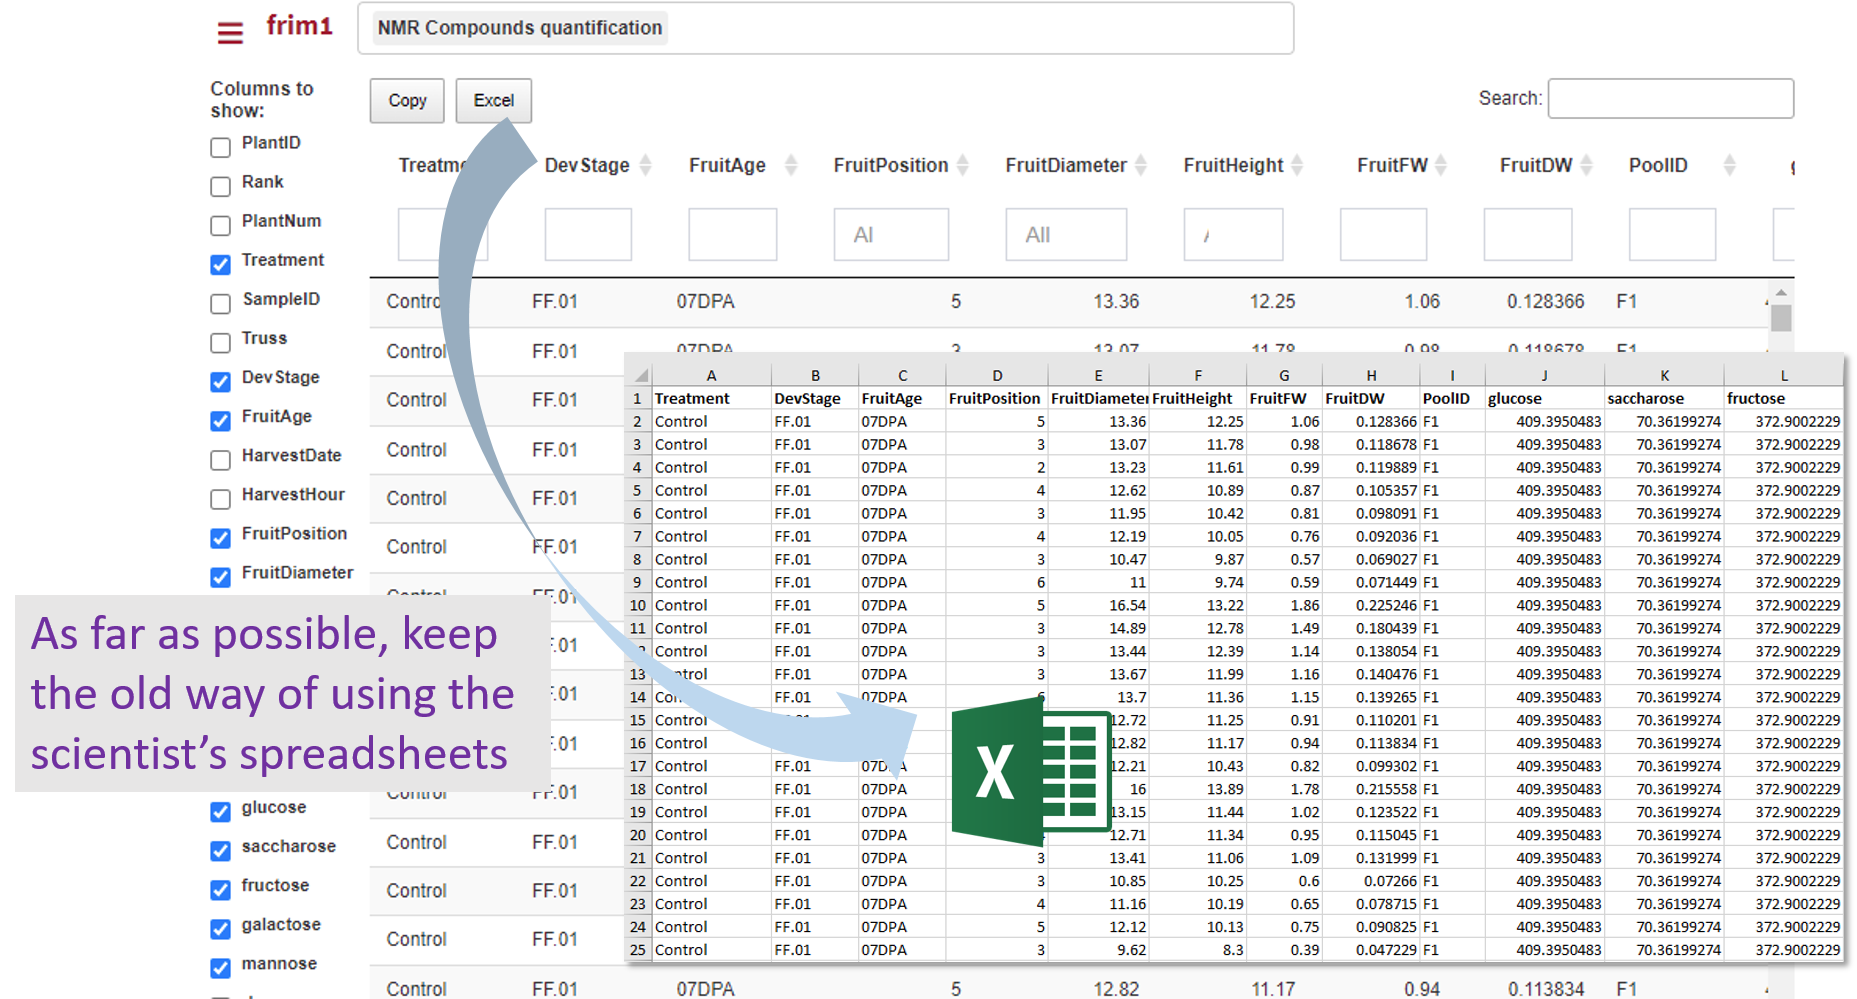
Export a previously selected data subset