Using ODAM
Using ODAM
The overall usage scheme of ODAM is shown in the following figure:
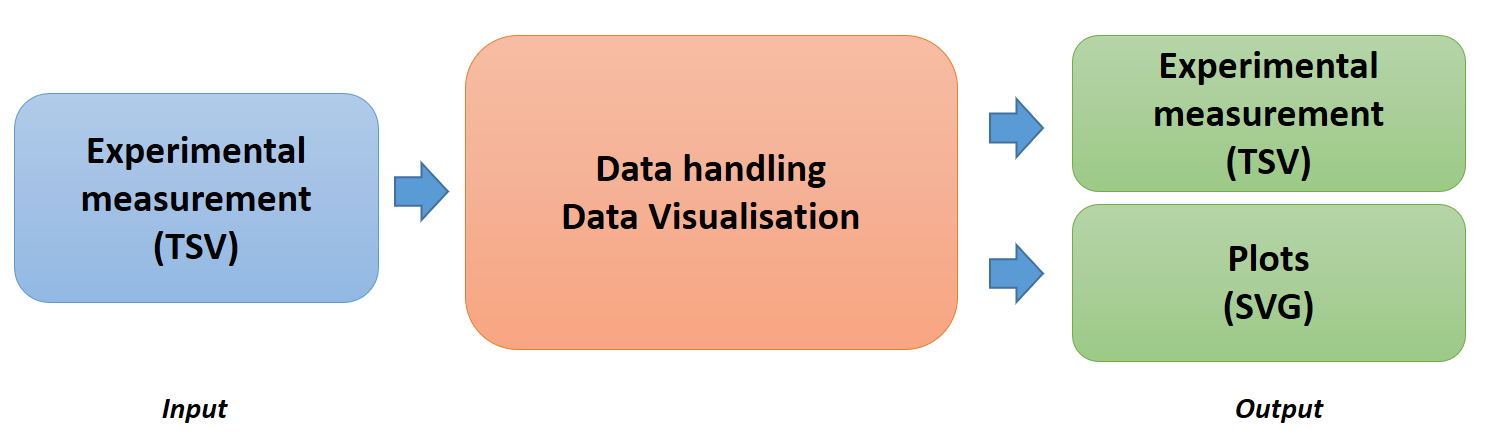
The overall usage scheme of ODAM
As input, we have the various data files from the experiment. You can view the data graphically (see Data Explorer) and you can also merge certain files based on common identifiers and then select a sub-part. The output is the file resulting from the query.
The central idea which has been the founding idea of ODAM, is that data producers "just" have to drag and drop their data tables onto a storage space, which depending on the chosen infrastructure can be local (i.e. their Desktop Computer, or a NAS) or remote (virtual disk space). See Installation section.
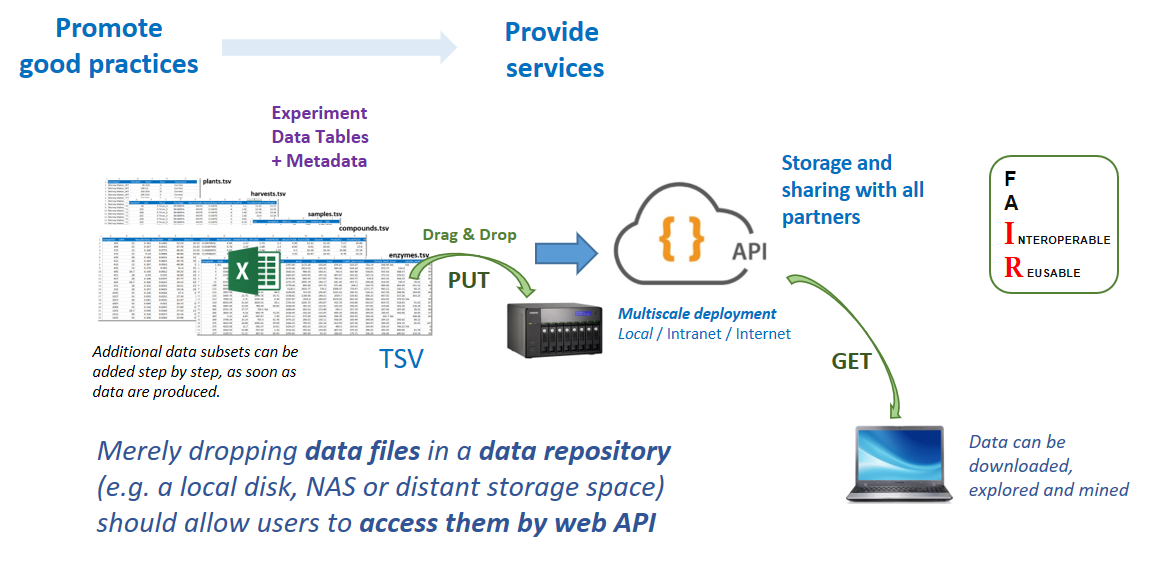
The central idea is that data producers "just" have to drag and drop their data tables onto a storage space depending on the chosen infrastructure (local, intranet, internet). An API (Application Programming Interface) layer is implemented which allows data handling (data selection and merging)
So simply dropping data files (along with two additional metadata files) on the storage space allows users to access them through web services. This means there is no need for additional configuration on the server. The dataset must first be previously formatted according to precise rules which requires that some good practices be followed and adhered to. See Data collection and preparation section.
Note: In case of having a remote storage space, the rclone tool might be a good choice. Several other tools or approaches can be used as: WinSCP, rsync, ...
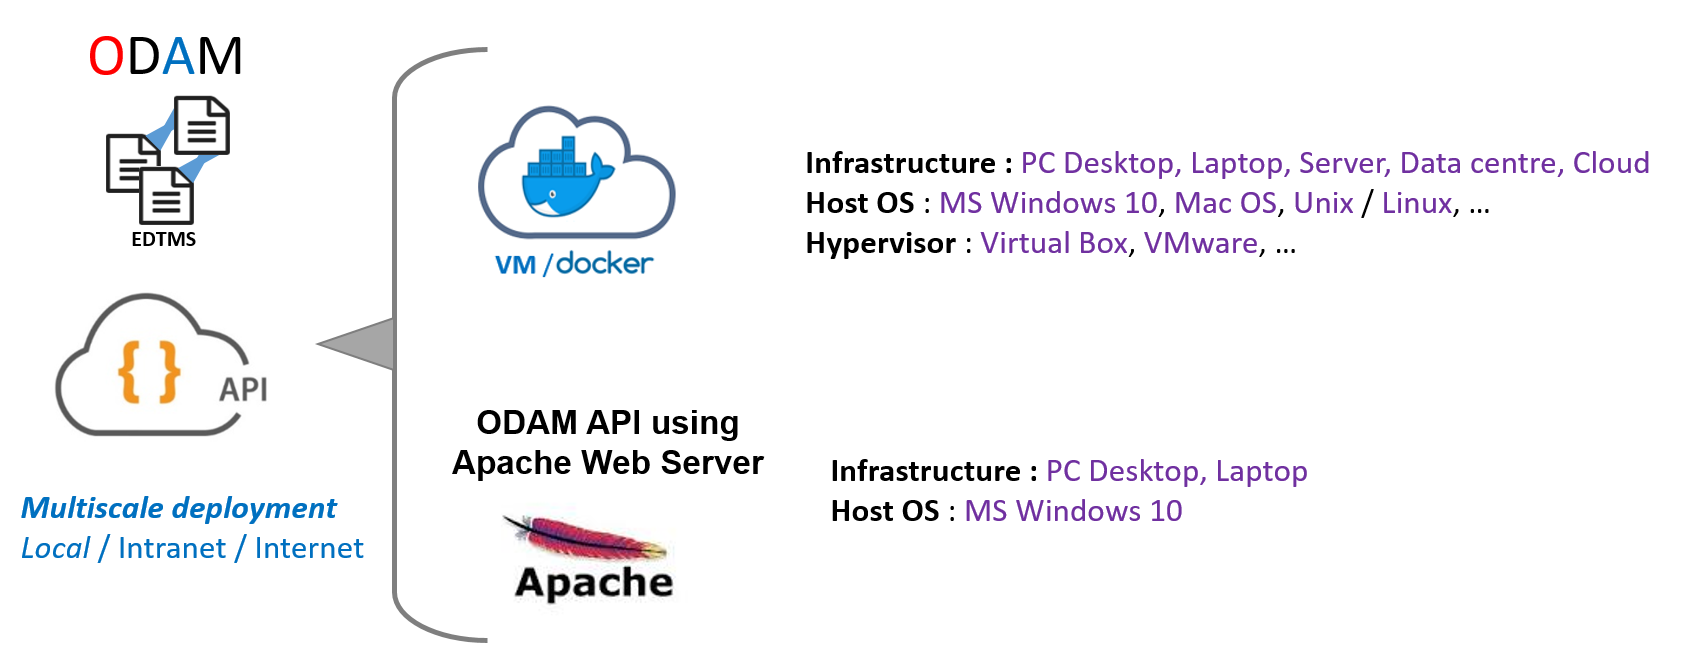
The ODAM software can be deployed at multiple scales (local, intranet, internet), depending on the need and the target community.
Provide Services
The ODAM software embeds an API (Application Programming Interface) layer which offers data selection and merging services. It is this API layer that allows interoperability between the different tables and the applications that will be able to use them (See Web API).
With the help of this layer, it opens up a whole ecosystem of potential applications, depending on your needs but also on your skills in the proposed tools.
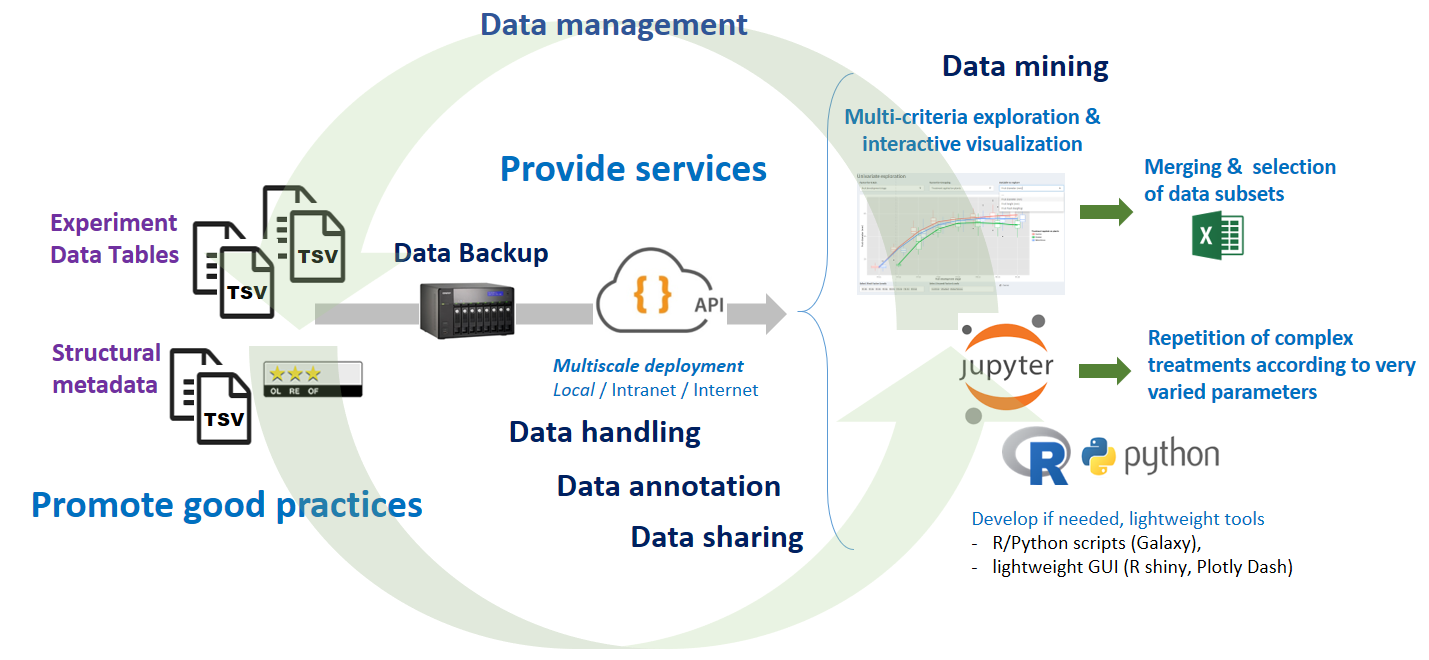
From the set of data files (which are uncombined tables, each corresponding to a particular observational unit that we name an entity), the user can: 1) Visualize the data associated with their metadata according to several criteria and in a completely interactive way with the help of the data explorer. 2) Export in tabular form subsets selected according to his criteria with combined, merged data. 3) Build and test its models more easily using a scripting language such as R, which allows it to repeat different scenarios according to a variety of parameters. An R package allows to perform extractions according to the same criteria as those proposed in the data explorer. All this is possible thanks to the API layer, which opens up a whole ecosystem of potential applications.
Export data from your web browser
You can retrieve data directly from your web browser based on the API. To understand the syntax, see Web API.
Test from the API Documentation on SwaggerHub
Example :
-
- First, view the subset list of a dataset along with the metadata
- https://pmb-bordeaux.fr/getdata/query/frim1?format=xml
-
- Then, retrieve a data table by merging “Activome Features” data (enzymes) and “NMR Compounds quantification” data
- https://pmb-bordeaux.fr/getdata/query/frim1/(activome,qNMR_metabo)?format=tsv
If you have associated the files having the extension '.txt' (tab as separator) with e.g. MS Excel, then just click on it to open it.
For more details on how API querie work, see a very detailed example of api querying.
Using the API with R
It is possible to adopt more efficient approaches to analyze data, e.g for automating various processing operations, or for allowing users to select subsets of data and then carry out numerous repetitions of complex processing operations according to a wide variety of parameters (scenarios).
For this purpose we have developed an R (Rodam) package that allows data extraction according to the API schema.
Install
require(devtools)
install_github("inrae/Rodam")
The Rodam package provides a set of functions to retrieve data and their metadata from data sets formatted according to the ODAM data structuring approach.
Rodam Package Manual
Vignette 'Demonstration of the functionalities of the Rodam package'
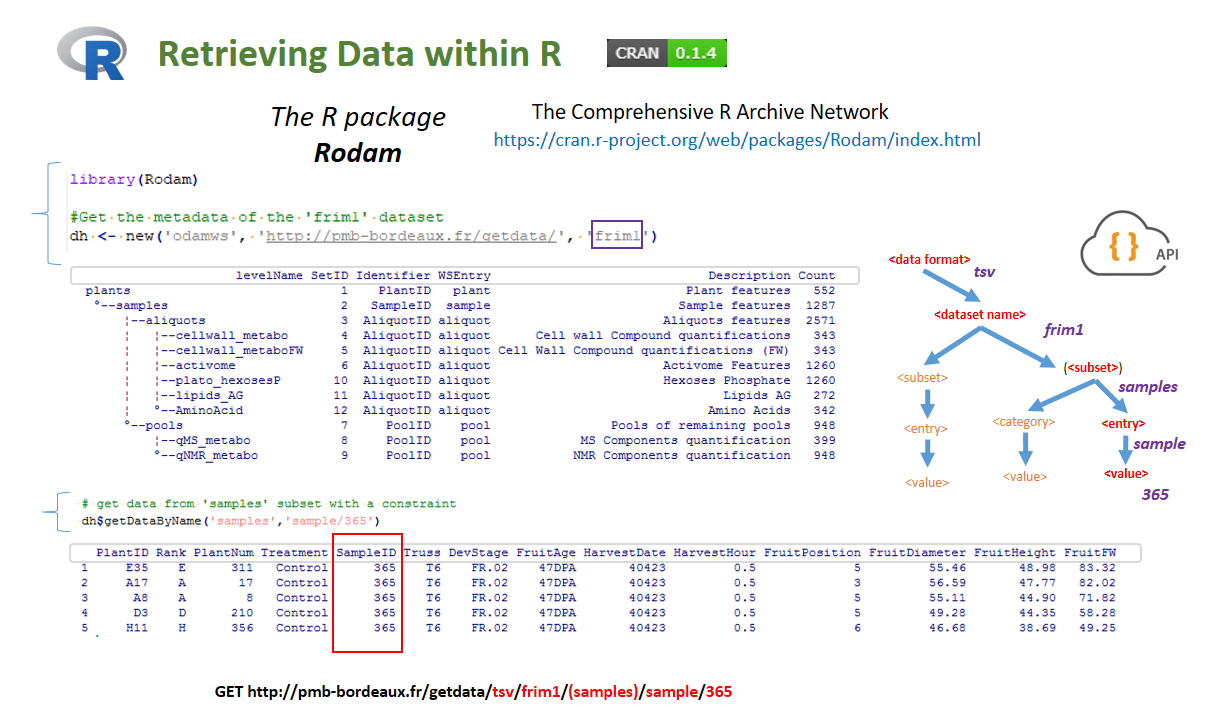
Illustration of the use of the API under R using the Rodam package. First of all (top) one can easily view the global structure of the data set. Then (bottom), one can apply a query for a single sample (here id 365) by returning a merge of several subsets (here plant+samples).
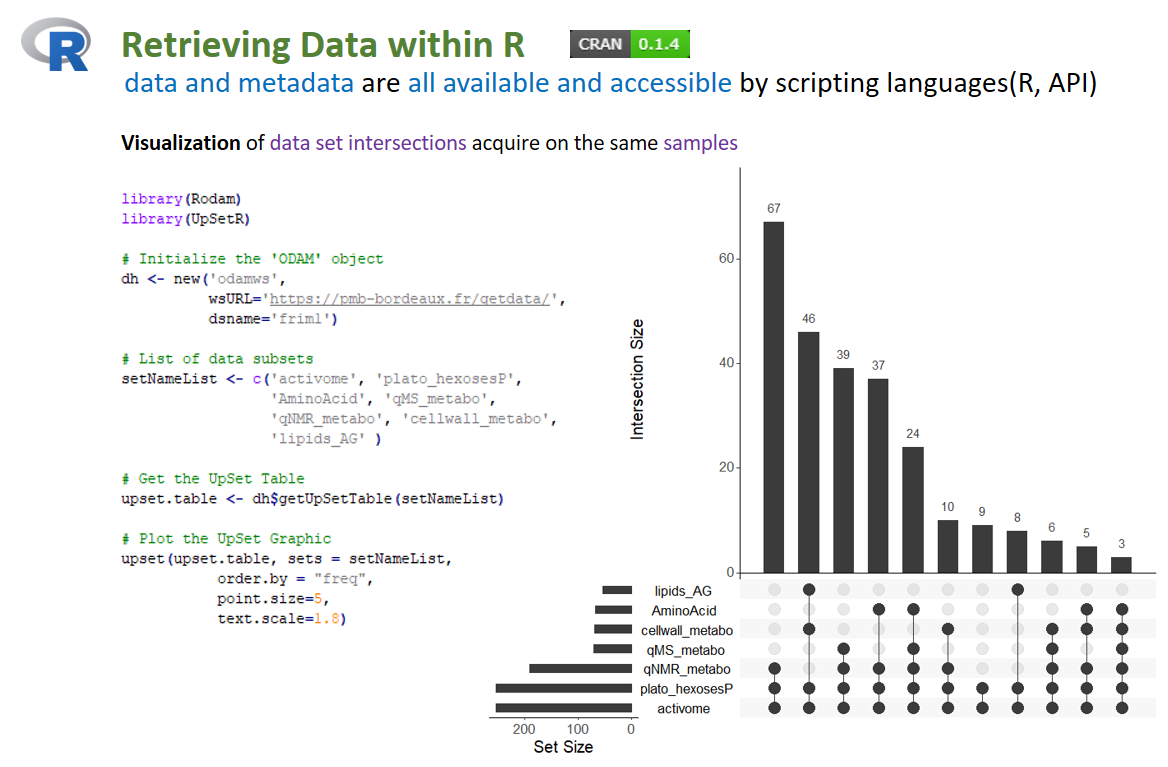
Illustration of the use of the API under R using the Rodam package. Visualization of set intersections between data subset based on the sample identifier and using the UpSetR package
Reproducible research with Jupyter notebooks
In order to illustrate a reproducible research process, we provide examples of Jupyter Notebooks (R & Python) based on the ODAM Web API, as well as links to view them (Jupyter nbviewer, CodeOcean) and re-run them (MyBinder, CodeOcean)
CodeOcean
Rodam API Demo : https://doi.org/10.24433/CO.8981049.v1
PyODAM API Demo : https://doi.org/10.24433/CO.0011270.v1
To Install Jupyter Notebook linked to your R version (and also Python), here is a simple tutorial.
Note : A good way to share your notebooks with colleagues or project members is to install the Littlest JupyterHub in a datacenter (institutional or in the cloud, like Elixir, for Europe, or IFB, for France). It is a simple JupyterHub distribution for a small (0-100) number of users on a single server. See e.g Using JupyterHub within a VM and on the Cloud.
Advantages of this approach
From a user's point of view, data collection should be done as early as possible in a project. There are several reasons:
First, experimental design is defined very early, so it is possible to share in the form of a spreadsheet the list of identifiers of individuals with their unique identifiers (plant identifiers) associated with the particular features defining the factorial group (metadata) such as: genotype, the type of treatment, its position in the greenhouse or in the field, … Thus, the array of the "plants" may be created even before planting the seeds. So too, the array of the "harvesting" can be done as soon as harvested, before any analysis. Then, each analysis comes complementing the dataset as soon as they produce their data subset.
Whether the data are acquired in the field or in the laboratory, their acquisition is carried out gradually, and is modified according to the first statistical treatments and preliminary results. This iterative aspect of production requires traceability and management tools. Typically, an experiment design often implies if followed as planned plenty of samples due to the multiplication of several numbers: number of factors X the number of factor levels X number of biological replication X different types of analysis X number of technical replication for each analysis type. Giving the possibility to explore the preliminary data (e.g. the distributions of some features of the samples), will allow scientists to eliminate outliers, thus avoiding subsequent analysis of these samples.
Data have to be accessible to everyone as soon as they are produced, allowing other data producers in the data string to link the identifiers of their analytical samples within the information system and subsequently allowing all partners to gather data with the metadata (factors, dates, ... ) of the Design of Experiment. By proceeding in this way, we ensure data coherence all the experiment time, and thus it becomes useless for each member to proceed a laborious investigation to find out who possesses the right identifiers.
From a technical point of view, the great advantage is to avoid the implementation of a complex data management system (requiring a data model) given that many changes can occur during the project. (possibility of new analysis, new measures or renouncing some others, ...). It also facilitates the subsequent publication of data: either the data can serve to fill in an existing database or the data can be broadcast through a web-service approach with the associated metadata. See Publish your data.
Tasks such as combining several data files are time-consuming and require repetitive and tedious handling (e.g data scientists spend 79% of their time on data preparation1). Similarly, when modeling, subsets have to be selected and many scenarios tested with different parameters. If performed manually (i.e., multiple copy-paste in a spreadsheet) these tasks are not only tedious but prone to handling errors. ODAM software is designed to perform precisely these tasks by providing several services for greater flexibility in data handling.
-
CrowdFlower, Data Science Report (2016) https://visit.figure-eight.com/rs/416-ZBE-142/images/CrowdFlower_DataScienceReport_2016.pdf ↩